Incorporating the macroeconomic effects of the tax plans of Hillary Clinton and Donald Trump changes our revenue estimates by a modest amount, according to updated analyses released by the Tax Policy Center yesterday. Taking account of macroeconomic feedback (dynamic scoring) would reduce the projected revenue increase under Clinton’s plan by about $95 billion over the 2017-2026 period, or about 7 percent. It would trim the projected revenue loss under the Trump plan by about $178 billion, or 3 percent.
The macroeconomic effects would be modest because the plans’ impact on incentives to work, save, and invest would be largely offset by their effects on the deficit. As a result, Clinton’s plan would reduce economic output in the short run but increase it in the longer term while Trump’s would boost economic activity in the short run but slow it in the long run.
The analyses TPC released yesterday used two different models of the economy: TPC’s own Keynesian analysis and the Penn-Wharton Budget Model (PWBM), an overlapping generations model maintained at the Wharton School at the University of Pennsylvania. Today’s papers update TPC’s traditional estimates of the revenue and distributional effects of both plans, which were released last week.
Using traditional scoring, TPC estimated that the Clinton plan would increase revenues by $1.4 trillion over ten years, almost entirely due to tax increases on high-income households. TPC found that the Trump plan’s big tax cuts would reduce revenues by $6.2 trillion over ten years, with the largest tax cuts going to the highest-income households.
The macroeconomic models look at the effects of taxes on the economy in very different ways. TPC’s Keynesian model assumes that economic output is driven primarily by short-run changes in aggregate demand for goods and services. Thus a tax cut tends to boost output because it increases after-tax incomes and consumer spending. Those changes can temporarily raise or lower overall economic output, but economic activity will return to its potential level after a few years.
By contrast, the PWBM measures how individual households respond to incentives to work, save, and invest. Reducing tax rates on labor income tends to increase labor supply while cutting tax rates on capital income tends to increase saving. Each would boost economic growth. The model also incorporates the impact of changing tax incentives on private investment—notably, moving to expensing in the Trump plan—as well as the tax plans’ effects on the deficit and interest rates.

TPC’s Keynesian model estimates that the Clinton plan, which would reduce overall after-tax incomes, would shrink output by 0.4 percent in 2017, by 0.2 percent in 2018, and by smaller amounts in the following three years. The more sluggish economy would lower taxable incomes, thus trimming revenue increases by $15 billion in 2017, $10 billion in 2018, and a total of $33 billion over five years, about a 7 percent drop. (Because the Keynesian model estimates only short-run effects on demand, its projections are not relevant beyond five years).
Trump’s plan would have the opposite effect on demand. His tax cuts would boost household incomes, increasing consumption and raising aggregate demand. In addition, his proposal to allow expensing of new business investment would boost capital spending.
TPC’s Keynesian model estimates that Trump’s plan would boost output by 1.7 percent in 2017, 1.1 percent in 2018, and smaller amounts through 2021. That would increase taxable incomes modestly, trimming revenue losses by $53 billion in 2017, $35 billion in 2018, and a total of $118 billion over five years.

The Wharton model shows roughly similar effects in the short run, but quite different ones over time.
Because Clinton’s plan would increase marginal tax rates on labor, it would decrease after-tax wages, discourage work, and reduce the labor supply. Similarly, by raising taxes on capital income, Clinton would lower the after-tax rate of return on saving and discourage private saving and investment.
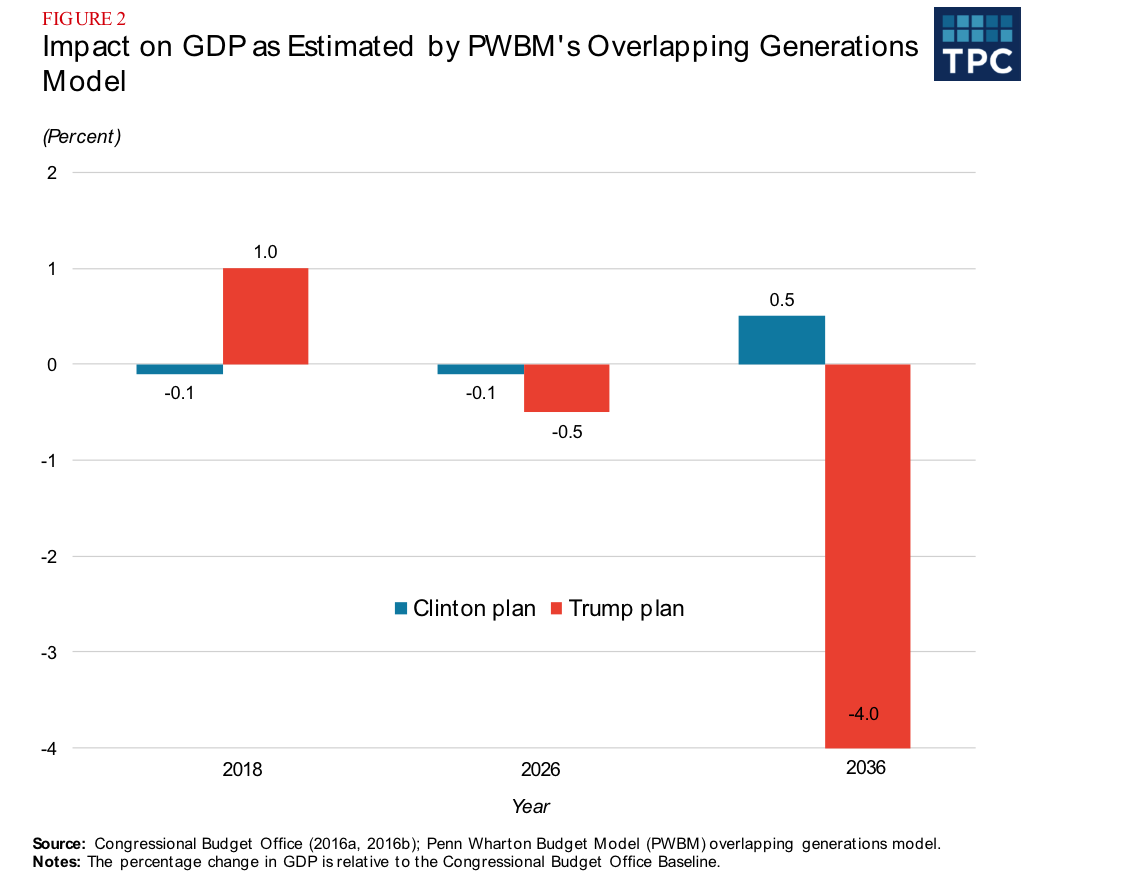
However, because her tax plan would also reduce the deficit, it would leave more funds available for business investment, with the effects growing over time, eventually making the plan’s impact on output more positive. The PWBM estimates that Clinton’s proposals would reduce GDP by 0.1 percent in 2017 and 2026, but increase output by 0.5 percent by 2036. The smaller economy in the early years would decrease revenues by $95 billion between 2017 and 2026, but faster economic growth would boost projected revenues by $126 billion over the subsequent decade.
Adding those macroeconomic effects to TPC’s conventional estimates shrinks the revenue gain under Clinton’s plan from $1.4 trillion to $1.3 trillion over 2017-2026, but then raises it from $2.7 trillion to $2.8 trillion over the next 10 years.
Trump’s plan would have opposite—and larger—effects on the economy. Reducing tax rates on labor income would encourage work and increase labor supply. Cutting taxes on capital income would raise the after-tax rate of return on saving while expensing would encourage business investment.
However, Trump’s plan would substantially increase the deficit, reducing funds available for private investment. That “crowding out” tends to grow over time, reducing—and eventually reversing—the plan’s positive effect on economic output.
The PWBM estimates that the Trump plan would boost GDP by 1.0 percent in fiscal year 2017, but reduce projected GDP by 0.5 percent in 2026 and by 4.0 percent in 2036. The result: The plan’s revenue loss would shrink by $178 billion between 2017 and 2026, but then grow by an additional $1.4 trillion over the next 10 years. Thus the revenue loss under the plan would decline from $6.2 trillion without macroeconomic effects to $6.0 trillion over 2017-2026, but rise from $8.9 trillion to $10.3 trillion over 2027-2036.
An important caveat is that both TPC and Wharton modeled the candidates’ tax plans only. They did not look at their spending proposals. (You can see how the estimates change under different assumptions about spending offsets using PWBM’s online simulator). Nor did we model Trump’s proposed changes in trade, regulatory, and energy policy.
Those analyses are for others to do. However, when looking at the candidate tax plans only, the macroeconomic effects make relatively little difference in their overall revenue effects.
