This post is part of the Tax Policy Center’s series, Tax Line, which digs into the data behind the day’s most pressing tax policy issues. You can read all posts in this series by clicking on the topics tag, TaxLine, at the bottom of this post.
The 50 states, with their unique mix of communities, industries, and other drivers of economic activity, vary dramatically in their ability to raise revenue. This affects how much each state can spend on public services, which means accurately measuring the available pool of taxable resources is an important consideration for policymakers and analysts.
Total taxable resources is one measure that helps the federal government see how much tax revenue a state is raising relative to its capacity. This is important since the federal government uses intergovernmental grants to help smooth out differences among the states.
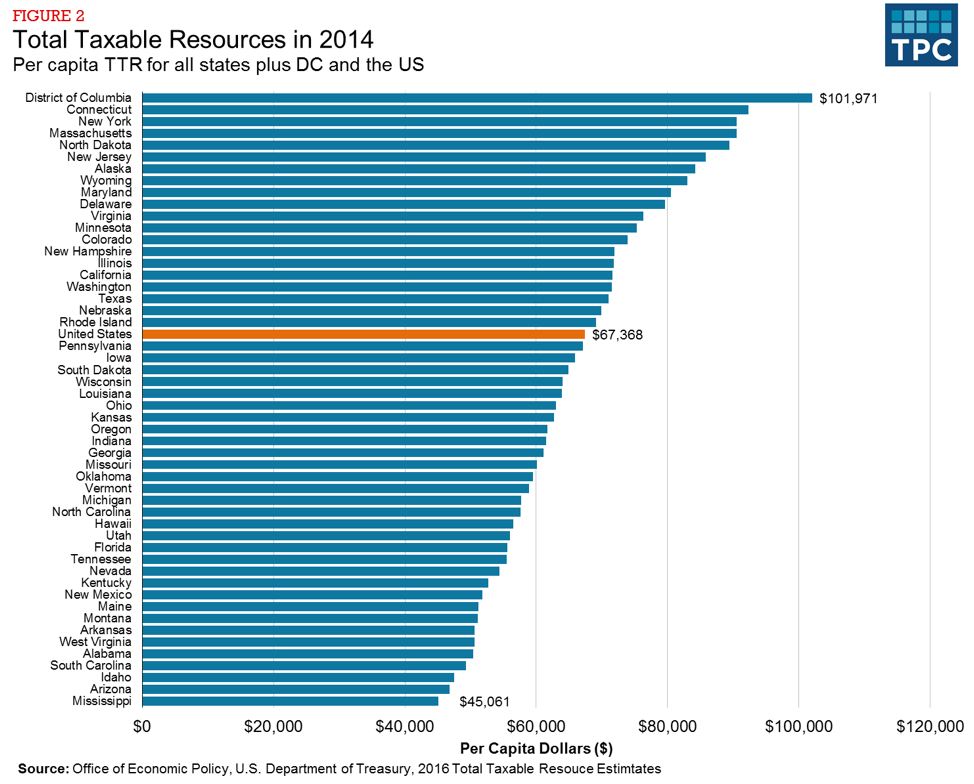
Looking at recently released Total Taxable Resources data for 2014 we see that that the population-dense East Coast states, and states with significant amounts of natural resources, generally had higher TTR than most rural and southern states. Eight states and the District of Columbia had TTR per capita in excess of $80,000. Four states – Mississippi, Arizona, Idaho and South Carolina – had less than $50,000 per capita, well below the national average of about $67,000.

There are three measures of revenue capacity that are commonly used: Gross State Product (GSP), Personal Income (PI), and Total Taxable Resources (TTR). Governments and researchers use these measures activity to judge the size of the taxable pie, which is a valuable exercise as long as the limitations of those metrics are understood.
Each illuminates a slightly different dimension of the state economy. GSP calculates the value of goods and services produced in a state. Personal income is the total income received by state residents. And TTR is an adjusted measure of GSP that adds in income flows from out of state and subtracts indirect federal taxes and contributions to social programs. In essence, TTR combines GSP and personal income to measure the total value of goods, services, and income that the state could tax. This means that TTR almost always exceeds GSP and personal income because it includes the taxable components of those two measures.
Not all of a state’s economic activity is equal. Thus, each measure has only limited value in explaining why one tax or fee might be preferred over another. A State and Local Finance Initiative report in March used detailed state data to calculate state-level revenue capacity for each major revenue source —the amount of revenue states could collect from taxes and fees, given its demographic and economic conditions.
Policymakers should use both our detailed methodology and the general economy-wide metrics to estimate a state’s capacity to raise revenue.
