A property tax is a tax levied on the value of "real property" (land and buildings, both residential and commercial) or personal property (business equipment, inventories, and noncommercial motor vehicles). State and local governments collected a combined $630 billion in revenue from property taxes in 2021.
Taxpayers in all 50 states and the District of Columbia pay property taxes, but the tax on real property is primarily levied by local governments (cities, counties, and school districts) rather than state governments. With a few exceptions, states typically levy taxes on personal property.
How much revenue do state and local governments raise from property taxes?
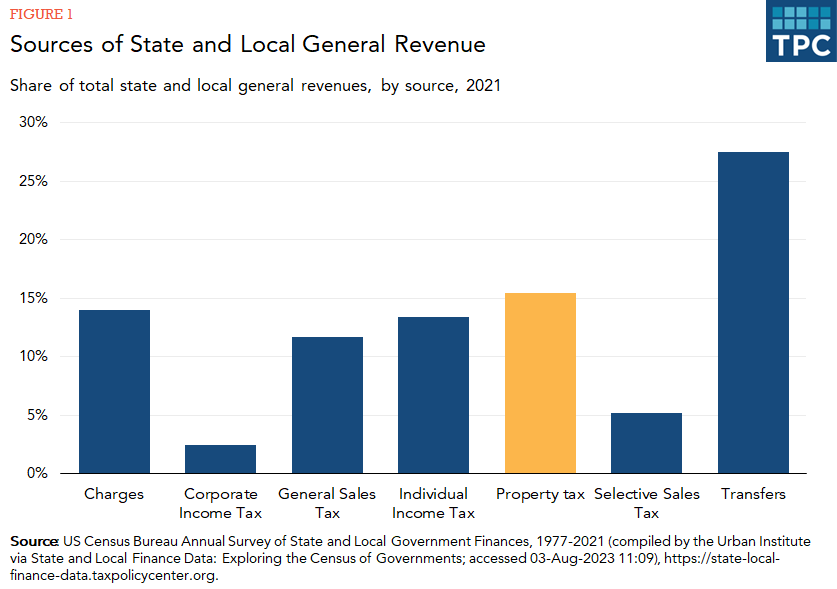
State and local governments collected a combined $630 billion in revenue from property taxes in 2021, or 15 percent of general revenue. Property tax revenue as a percentage of state and local general revenue was higher than general sales tax revenue, individual income tax revenue, and corporate income tax revenue in 2021.

Property taxes are a very small source of revenue for states because states typically tax personal property but not real property. (Census does not provide a separate count for each type of property tax.) State governments collected $20 billion from property taxes in 2021, or 1 percent of state general revenue. In contrast, property taxes are one of the largest sources of revenue for local governments. Local governments collected $609 billion in property taxes in 2021, or 30 percent of local general revenue.
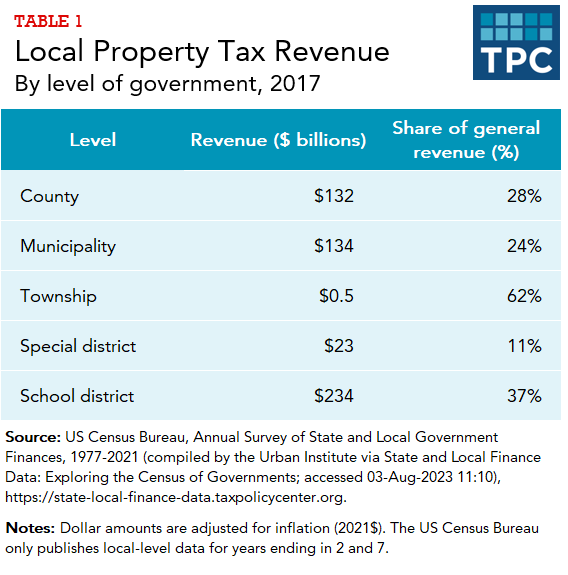
Counties, municipalities, townships, special districts, and school districts all collect property tax revenue, and it typically accounts for a significant share of general revenues in each of those jurisdictional levels. Property tax revenue is a smaller share of special district general revenue because these specific-purpose jurisdictions, such as water and sewer authorities, typically get most of their revenue from taxes related to those services.

Which states are most reliant on property tax revenue?
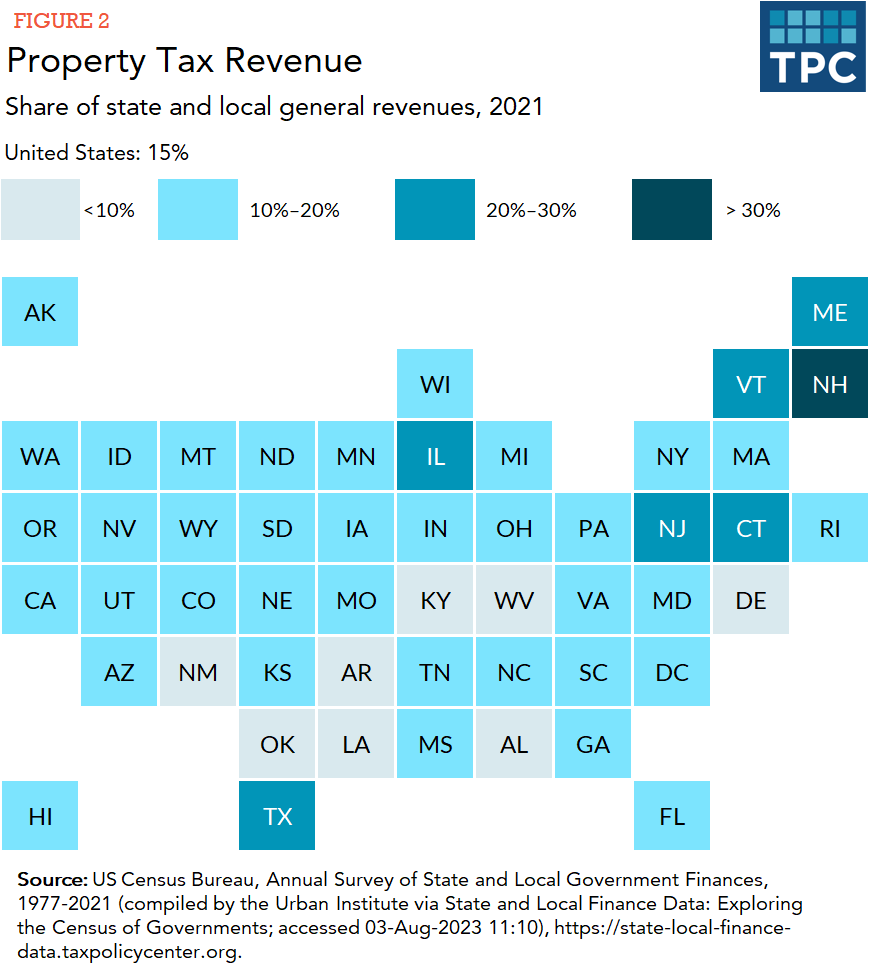
All states have property taxes (at least at the local level). New Hampshire was the most reliant on property tax revenue in 2021, as the tax accounted for 33 percent of its combined state and local general revenues. (New Hampshire does not have a broad-based individual income tax or general sales tax). The next most reliant states were New Jersey (27 percent), Connecticut (23 percent), and Maine (23 percent). Overall, seven states collected 20 percent or more of their state and local general revenues from property taxes in 2021.

Data: View and download each state's general revenue by source as a percentage of general revenue
In contrast, Alabama, Arkansas, Delaware, Kentucky, Louisiana, New Mexico, Oklahoma, and West Virginia collected less than 10 percent of their state and local general revenue from property taxes.
Looking solely at own-source revenues (i.e., excluding transfers from federal and state governments), property taxes accounted for nearly half (48 percent) of local general revenue. In Connecticut, Maine, Massachusetts, New Hampshire, New Jersey, and Rhode Island, property tax collections were more than three-quarters of local own-source general revenue in 2021. In contrast, Alabama’s local governments collected just 19 percent of their own-source revenue from property taxes, the lowest percentage in any state.
At the state level, property taxes accounted for 1 percent of state own-source general revenue in 2021. However, Vermont’s property taxes contributed 23 percent of its state own-source general revenue that year, far and away the highest percentage in any state. Nearly all of Vermont’s education spending is financed at the state level, and the state's property tax on real property is the largest source of that funding. The next-highest percentage was in Washington (10 percent). Property taxes were also 7 percent or more of state own-source revenue in Arkansas, New Hampshire, and Wyoming. In addition to business equipment and cars, state personal property taxes are sometimes levied on land that is used for utilities. Fourteen states did not levy a state-level property tax in 2021.
The percentage of state and local general revenue from property taxes in a state is not a proxy for the tax burden on homeowners. Instead, it reflects several factors, including:
- the property tax rates in a state’s local jurisdictions
- the value of the property, both residential and commercial, in the state
- the relative amount of tax revenue in the state from other sources
How much do real property tax rates differ across the country?
Real property tax rates differ widely both across and within states, making it difficult to compare states against each other. Further, local governments use different methods to calculate their real property tax bases and assessment levels.
Every jurisdiction’s property tax requires at least three steps:
- Assess the value of each property in the jurisdiction.
- Determine the taxable value of each property.
- Apply the tax rate to the taxable value of each property.
The government levying the property tax typically assesses the real property value by estimating what the property would sell for in an arms-length transaction (that is, a transaction between unrelated parties). However, there are other calculations for assessing a property’s value. Some jurisdictions base their assessed value on the last sale price or acquisition value of the property, the income a property could generate (e.g., hotels), or solely on the size or physical attributes (e.g., design or location) of the property. The timing of assessments also varies, with some jurisdictions assessing annually and others going multiple years between assessments.
Further, some jurisdictions impose their tax on the entire assessed value of the property while others tax only a fraction of the assessed value. For example, South Carolina counties impose tax on only 4 percent of an owner-occupied property’s assessed value, while the District of Columbia taxes 100 percent of a property's assessed value. As a result, the tax rate in South Carolina counties is higher than the tax rate in the District of Columbia, but that is not an apples-to-apples comparison.
Some local jurisdictions also impose different tax rates—or classifications—for different types of property, most commonly distinguishing between residential and commercial (i.e., business) property.
And while property tax rates can vary considerably within states, some states impose a statewide limit on the maximum rate.
States and local governments also often use other limits, exemptions, deductions, and credits to lower a real property’s taxable value or the taxpayer’s payment for some or all owners. A few major examples are as follows:
- Assessment limits prevent a property’s assessed value from increasing by more than a fixed percentage between assessments. These limits generally reduce a property’s assessed value below its actual market value and thus prevent rapid property value increases from significantly raising the owner’s property tax payment. However, when the property is sold, its assessed value is reset at its market value. Seventeen states and the District of Columbia offered some type of limitation on a property's assessed value in 2021. The property eligible for an assessment limitation and the calculation of the limit (i.e., the percentage increase in assessment allowed over a time period) varies across states.
- Homestead deductions or exemptions decrease the taxable value of real property by a fixed amount (much the same way a standard deduction decreases taxable income). While every state has residency requirements for claiming a homestead exemption, some states have further eligibility qualifications based on age, disability, income, or veteran status. Nearly every state and the District of Columbia broadly offered some type of homestead exemption or credit in 2021.
- Circuit breaker programs provide relief for elderly and low-income residents with property tax liabilities above a specified percentage of their income. Although the tax relief is based on property tax payments, it is typically provided via an individual income tax credit. Unlike the other approaches described here, circuit breakers can benefit renters as well as homeowners in some jurisdictions. Thirty-one states and the District of Columbia offered some form of circuit breaker program in 2021. In 18 of these states and the District of Columbia, renters were eligible for the circuit breaker program.
- Property tax deferrals allow elderly and disabled homeowners to defer payment until the sale of the property or the death of the taxpayer. Twenty-seven states and the District of Columbia allowed such deferrals in 2021, but they are not widely used.
These relief programs can create significantly different tax burdens within a jurisdiction even among taxpayers who have homes of similar vintage and pay the same tax rate.
Further, while these policies can help individual homeowners reduce their property tax payments, various studies have shown that property tax assessments and appeals outcomes can disproportionately help white homeowners and disproportionally burden Black and Latino households. This can make a locality's property tax system more regressive than it appears.
More detailed information on property tax relief and incentive programs, for all 50 states, can be found at the Lincoln Institute's Property Tax Database.
Updated January 2024
Lincoln Institute of Land Policy. 2023. Significant Features of the Property Tax. Cambridge, MA.
Brosy, Thomas. 2023. The Future Of Commercial Real Estate And Big City Budgets. TaxVox (blog). Washington, DC: Urban-Brookings Tax Policy Center.
Hunter, Lillian, Sadie Bograd, and Aravind Boddupalli. 2023. Detroit Considers Shift From Property To Land Value Taxation. TaxVox (blog). Washington, DC: Urban-Brookings Tax Policy Center.
Gordon, Tracy. 2020. Critics Argue The Property Tax Is Unfair. Do They Have A Point?. TaxVox (blog). Washington, DC: Urban-Brookings Tax Policy Center.
Avenancio-León, Carlos, and Troup Howard. 2020. The Assessment Gap: Racial Inequalities in Property Taxation. Available at http://dx.doi.org/10.2139/ssrn.3465010.
Interactive Data Tools
State and Local Finance Data: Exploring the Census of Governments