Fines, fees, and forfeitures are financial penalties imposed for violations of the law. State and local governments collected a combined $13 billion in revenue from fines, fees, and forfeitures in 2021.
Fines and fees include parking tickets and speeding tickets (including those from traffic cameras), court-imposed fees used to cover administrative costs and other criminal justice-related charges and penalties. A forfeiture is when the police seize property that is believed to be connected to a crime. (The US Census Bureau excludes library fines, sales of confiscated property, and any penalties relating to tax delinquency from these totals.)
Although fines, fees, and forfeitures constitute a small share of the overall revenue that states, cities, and townships collect, these financial penalties can have disproportionate impacts on communities.
How much revenue do state and local governments raise from fines, fees, and forfeitures?
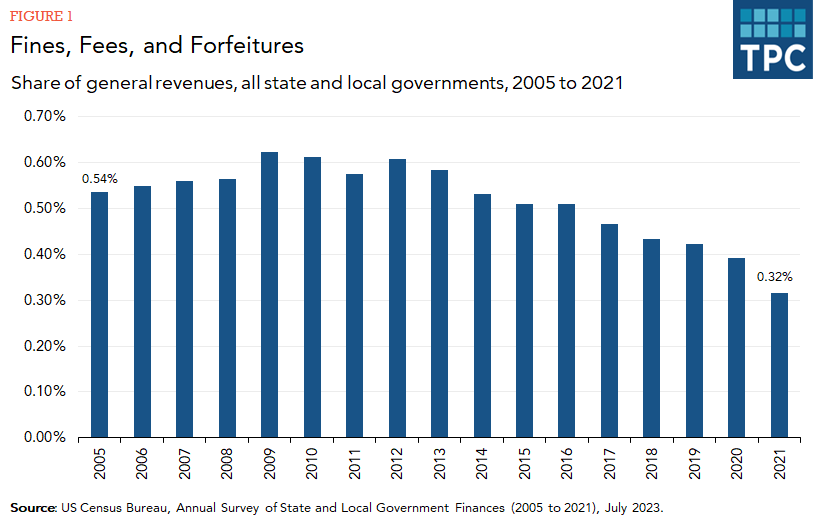
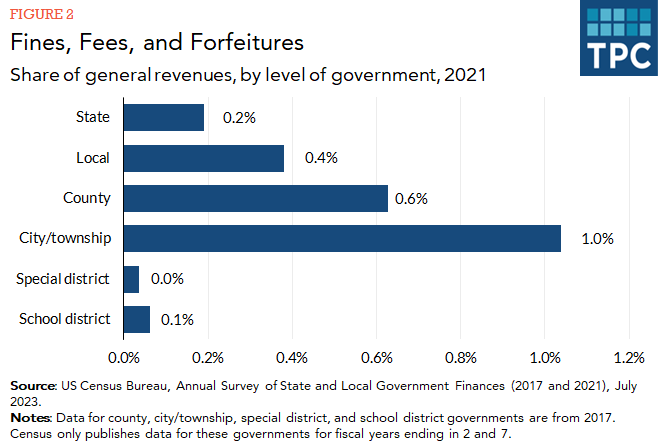
According to the US Census Bureau, state and local governments collected a combined $12.9 billion in revenue from fines, fees, and forfeitures in 2021, which was 0.3 percent of state and local general revenue. State governments collected $5.1 billion (0.2 percent of state general revenue) and local governments collected $7.7 billion (0.4 percent of local general revenue).
Revenues from fines, fees, and forfeitures in 2021 were lower than in preceding years ($15.5 billion in 2019 and $14.9 billion in 2020), in part due to the COVID-19 pandemic. In the last two decades, revenues peaked between 2009 and 2013, wherein it averaged $18.7 billion (in inflation-adjusted terms) or 0.6 percent of state and local general revenue.

Among local governments, cities and townships typically collect the most revenue from fines, fees, and forfeitures. In 2017 (the most recent year data are available), fines, fees, and forfeitures provided 1.0 percent of general revenues for cities and townships.

[Note on data: Census publishes data for state governments and local governments (in the aggregate) every year, but only publishes comprehensive data on counties, cities, townships, school districts, and special districts for fiscal years ending in 2 and 7. (The 2017 data cited on this page were released in 2019. However, Census does publish data for specific large counties and cities (e.g., the city of New Orleans) every year. As such, the data years in this backgrounder may vary depending on what is being discussed.]
Which localities are most reliant on revenues from fines, fees, and forfeitures?
In general, smaller cities and townships tend to rely more heavily on fines, fees, and forfeitures than larger cities. On average, cities with populations under 100,000 raised 2.6 percent of general revenue from fines, fees, and forfeitures in 2017, while cities with populations over 100,000 collected 1.6 percent from fines, fees, and forfeitures.
But these averages can mask huge variation across specific cities and towns. In fact, six small cities and towns relied on fines, fees, and forfeitures for over half of their general revenue in fiscal years 2007, 2012, and 2017: Anacoco, Louisiana; Fisher, Louisiana; Grady, Arkansas; Hanging Rock, Ohio; Jamestown, South Carolina; and Oliver, Georgia. All six jurisdictions are located around major highways and spent at least a third or more of their budgets on law enforcement activities in 2017.
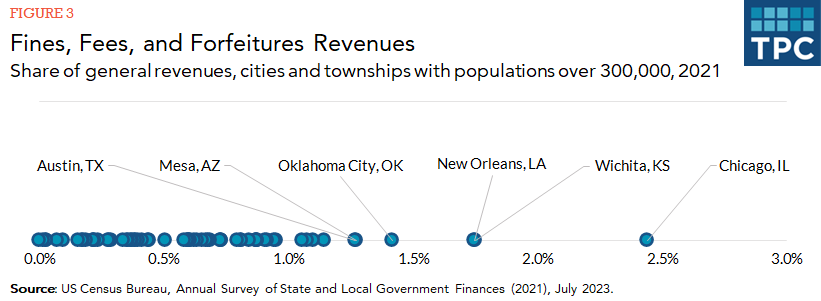
There is also variation among larger cities, but to a far lesser extent. Among cities and townships with populations greater than 300,000, those most reliant on fines, fees, and forfeitures in 2021 were Chicago, Illinois (2.4 percent of its general revenue), Wichita, Kansas (1.8 percent), New Orleans, Louisiana (1.7 percent), Oklahoma City, Oklahoma (1.4 percent), and Mesa, Arizona and Austin, Texas (both 1.3 percent).

In total, New York City raised the most revenue from fines, fees, and forfeitures locally ($1.0 billion), but that comprised only 0.9 percent of its general revenue. Only three other cities or townships raised over $100 million from fines, fees, and forfeitures revenues: Chicago ($226 million), the District of Columbia ($145 million), and Los Angeles ($105 million)
What are the criticisms of fines, fees, and forfeitures?
Two major criticisms of fines, fees, and forfeitures are that they unfairly burden some residents and communities and that they create harmful incentives for criminal justice programs.
Even though fines, fees, and forfeitures are typically a small share of a jurisdiction’s revenue, they can have a devastating effect on lower-income residents, particularly Black and Latinx households. Various studies have shown that the people most often subject to fines, fees, and forfeitures are disproportionately low-income and people of color. Further, cities with larger Black populations tend to rely more on fines and court fees to raise revenue. Racial bias, profiling, and stereotyping also contribute to people of color being disproportionately targeted, and this in turn further exacerbates racial disparities.
People who are unable to pay fines or who have their money or property forfeited can also face severe consequences, including having their driver’s license suspended, having their credit score lowered, losing their voting rights, losing jobs or housing, and facing arrest or jail time. This is particularly problematic in part because those most stopped for traffic citations are often those least able to pay.
Fines, fees, and forfeitures can also create conflicts of interest for law enforcement agencies. That is, if state and local governments depend on these citations for funding public services, law enforcement agencies and courts could be encouraged to aggressively issue citations and fines. This in turn can lead to a misallocation of resources as law enforcement agencies focus on collecting funds rather than on other public safety tasks.
Further, in some jurisdictions, fines, fees, and forfeitures directly fund the criminal justice program that collects them (rather than going to the government’s general fund), creating an even more corrosive incentive to issue such citations. For example, a police department seizing cash or property related to a crime can keep 80 percent to 100 percent of the forfeiture proceeds in 32 states.
In at least 43 states, some portion of speeding ticket revenue is distributed to courts or law enforcement. Seventeen states allocate a share of fines to courts or law enforcement funds, 39 states distribute some fees to these uses, and some do both. In most states, accumulated fees far exceed the base fines, which contributes to the high incidence of unpaid speeding tickets and outstanding court debt. In some states, these revenues support special highway or health care programs. With funding from fines and fees, these programs can become reliant on revenue from more speeding tickets being handed out so as to fund their day-to-day operations, sometimes called the “broken budget model.”
Overall, fines and fees are also generally an unreliable sources of revenue. Most judges are not mandated to hold “ability-to-pay" hearings (i.e., they do not consider whether defendants have the means to pay the charge), which leads to billions of dollars in uncollected debt. Many state and local governments also lack sufficient data to assess the efficacy of their court-imposed fines and fees because they do not closely track the costs of ensuring enforcement and compliance, such as those for public defenders, parole and probation officers, and license and revenue agencies.
As a result, case studies have revealed that court-imposed fines and fees are often inefficient: some counties are spending up to $1.17 in court hearing and jail costs for every $1 they ultimately collect.
Finally, when communities view their courts and police departments as exploitative (what some call "police for profit"), their confidence in the criminal justice system is undermined.
Updated January 2024
Mucciolo, Livia, Fay Walker, and Aravind Boddupalli. 2023. What Parking Ticket Data Can (and Cannot) Tell Us amid Calls to Reform Fines and Fees. UrbanWire (blog). Washington, DC: Urban Institute.
Boddupalli, Aravind, and Kim Rueben. 2022. States Can Help Reduce the Burdens of Harmful Fines and Fees. Here’s How. TaxVox (blog). Washington, DC: Urban-Brookings Tax Policy Center.
Boddupalli, Aravind, and Livia Mucciolo. 2022. Following the Money on Fines and Fees. Washington, DC: Urban-Brookings Tax Policy Center.
Highsmith, Brian, et al. 2020. Fees, Fines, and the Funding of Public Services: A Curriculum for Reform. New Haven, CT: Yale Law School.
Calame, Sarah, and Aravind Boddupalli. 2020. Fines and Forfeitures and Racial Disparities. TaxVox (blog). Washington, DC: Urban-Brookings Tax Policy Center.
Menendez, Matthew, et al. 2019. The Steep Costs of Criminal Justice Fees and Fines. New York, NY: Brennan Center for Justice.
Knepper, Lisa, et al. 2020. Policing for Profit: The Abuse of Civil Asset Forfeitures. Arlington, VA: Institute for Justice.
Gordon, Tracy, and Sarah Gault. 2015. Ferguson City Finances: Not the New Normal. UrbanWire (blog). Washington, DC: Urban Institute.
Harris, Alexes. 2016. A Pound of Flesh: Monetary Sanctions as Punishment for the Poor. American Sociological Association’s Rose Series in Sociology. New York, NY: Russell Sage Foundation.
Interactive data tools
What Would It Take for States to Reform Local Fines and Fees?