Taxpayers can choose to itemize deductions on their tax returns in lieu of claiming a standard deduction. Prior to 2018, around 30 percent of taxpayers, mostly those with higher incomes, chose to itemize, but increases in the standard deduction and limits to itemized deductions starting in 2018 have greatly reduced the number of itemizers.
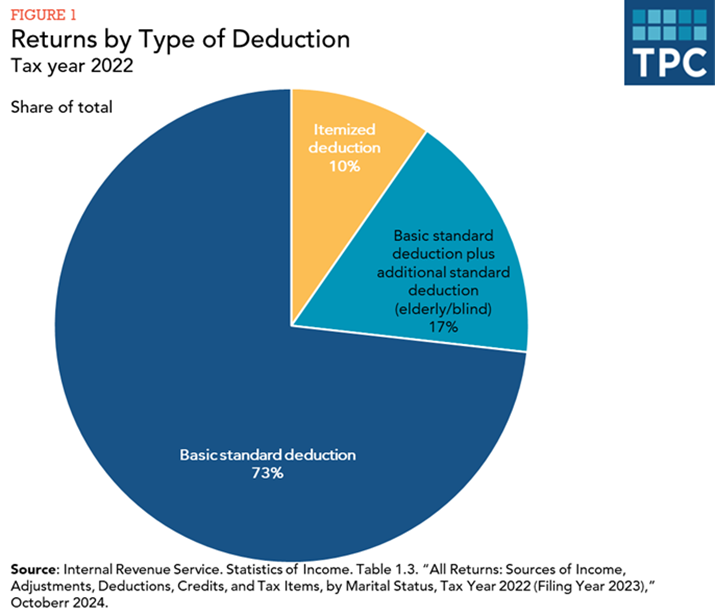
Taxpayers can either take a standard deduction or itemize their deductions to reduce the taxable income on their federal income tax return. Taxpayers typically choose to itemize when they can claim more on itemized deductions than on the standard deduction. In tax year 2022, about 10 percent of taxpayers chose to itemize (figure 1).
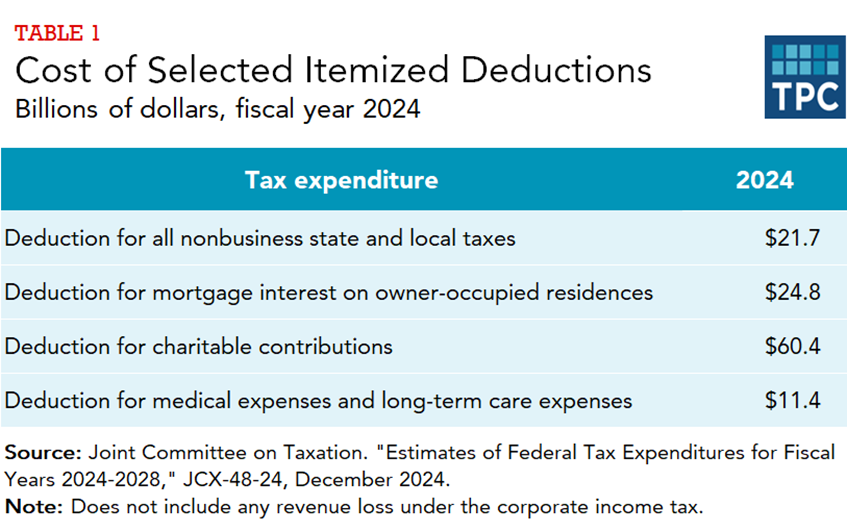
The most common itemized deductions are those for state and local taxes, mortgage interest, charitable contributions, and medical and dental expenses. The combined revenue cost of those four deductions is around $118 billion for fiscal year 2024 (table 1). However, as Toder and Berger (2019) have noted, the aggregate cost of itemized deductions in forgone tax revenue is less than the sum of the costs of each separate tax. TPC projects that forgone tax revenue from all itemized deductions accounting for those interactions will be about $130 billion in 2026 (following enactment of the OBBBA).
How Did the Tax Cuts And Jobs Act and the One Big Beautiful Bill Act Affect Itemized Deductions?
The 2017 Tax Cuts and Jobs Act (TCJA) significantly reduced the number of taxpayers who claim itemized deductions, because it substantially increased the standard deduction while also restricting or eliminating some itemized deductions for 2018 through 2025. Most significantly, the law placed an annual ceiling of $10,000 on the deduction for state and local taxes. In 2017, 31 percent of all individual income tax returns had itemized deductions, compared with just 10 percent in 2022.
These changes also substantially lowered the revenue costs of all itemized deductions for years after 2018 because fewer taxpayers claim them and, in some cases, the amount they claim has fallen too.
The One Big Beautiful Bill Act (OBBBA) slightly increased the standard deduction and made some of the TCJA changes to itemized deductions permanent. The OBBBA increased the maximum annual limit on the state and local tax deduction to $40,000 through 2029. In addition, beginning in tax year 2026, a new limit will reduce the value of itemized deductions for taxpayers in the top 37 percent tax bracket, effectively capping their value at 35 percent.
Who Itemizes?
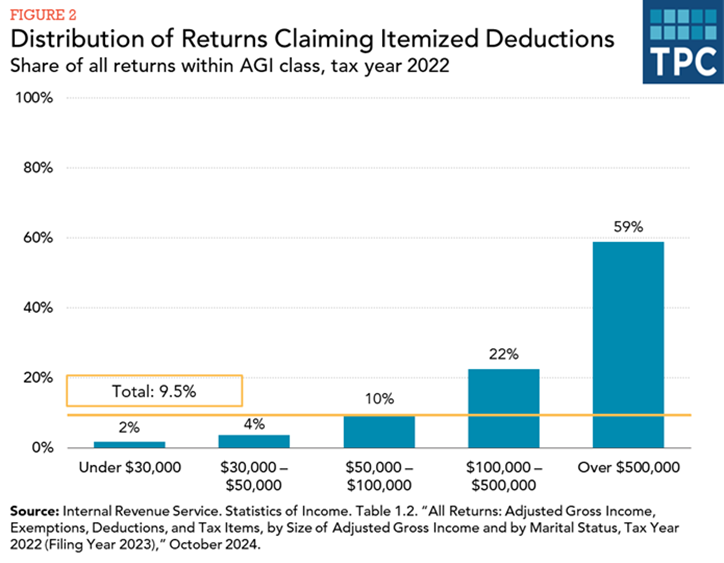
High-income taxpayers are much more likely to itemize than others. In tax year 2022, nearly two-thirds of tax returns reporting adjusted gross income (AGI) over $500,000 itemized deductions, compared with 10 percent of those with AGI between $50,000 and $100,000 and two percent of those with AGI under $30,000 (figure 2).
What Expenses Do Itemizers Deduct?
Among the 15.3 million tax returns claiming itemized deductions in tax year 2022, the average amount claimed was around $44,000. The average amount claimed for those claiming deductions mostly rose with income, from about $28,000 for taxpayers with AGI under $30,000 (largely for medical and dental expenses) to over $147,000 for those with AGI over $500,000 (largely for charitable contributions) (figure 3). If we also take into account the share of taxpayers who did not itemize, the average amount claimed per individual income tax return was about $600 for taxpayers with AGI under $30,000, compared with about $86,000 for taxpayers with income over $500,000.
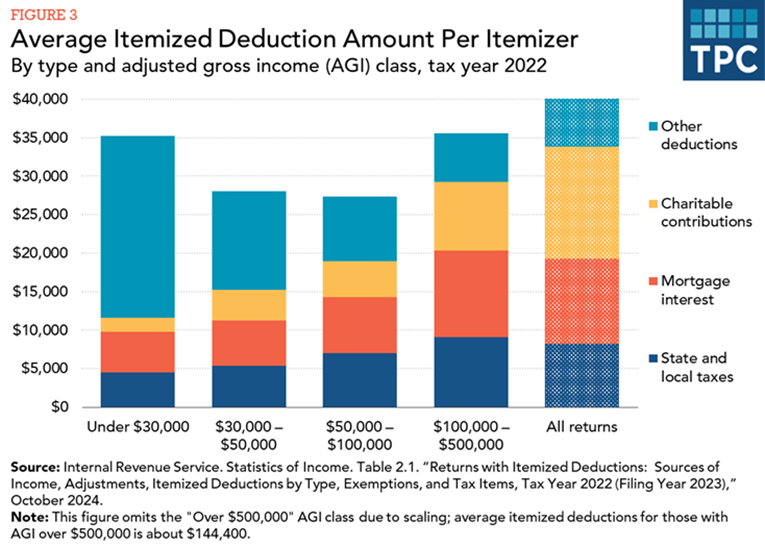
Altogether, the deduction for state and local taxes accounted for 19 percent of the total amount of itemized deductions in tax year 2022, whereas the deduction for mortgage and other interest made up 26 percent and the deduction for charitable contributions made up 33 percent (figure 3).
How Has the Share of Itemizers Changed Over Time?
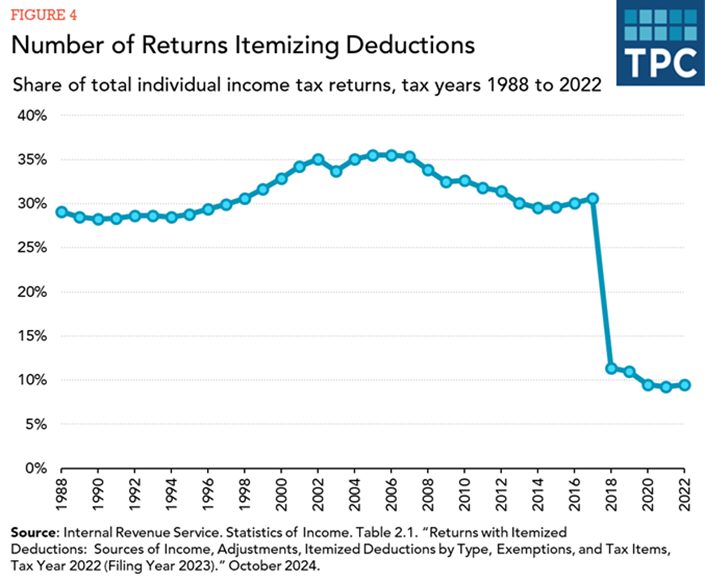
The share of returns that itemize deductions climbed from 28 percent in 1994 to a peak of 36 percent in 2005, before dropping to 31 percent in 2017 and, post-TCJA, down to 9.5 percent in 2022 (figure 4).
To better understand the trend pre-TCJA, a closer look at the three largest deductions—state and local taxes, home mortgage interest, and charitable contributions—helps (figure 5).
State and local taxes: Nearly all itemizers deduct state and local taxes, up to 99 percent both pre-TCJA and post-TCJA. A 2004 law that allowed taxpayers to deduct state and local sales taxes in lieu of income taxes slightly increased the number of itemizers taking this deduction.
Home mortgage interest: Before 2006, between 81 and 83 percent of itemizers deducted mortgage interest. But that share steadily dropped to a low of 73 percent in 2016, consistent with the decline in homeownership following the housing bubble collapse and falling mortgage interest rates. The amount of mortgage interest deducted by taxpayers increased sharply from 2004 to 2008 but fell through 2017 because of falling housing values and historically low mortgage rates, before climbing back up to 76 percent in 2022.
Charitable contributions: The share of itemizers reporting charitable contributions declined from 91 percent in 1988 to 80 percent in 2022. Much of that drop occurred between 2005 and 2007, after Congress required written confirmations of cash gifts and limited deductions for donations of clothing and used vehicles.
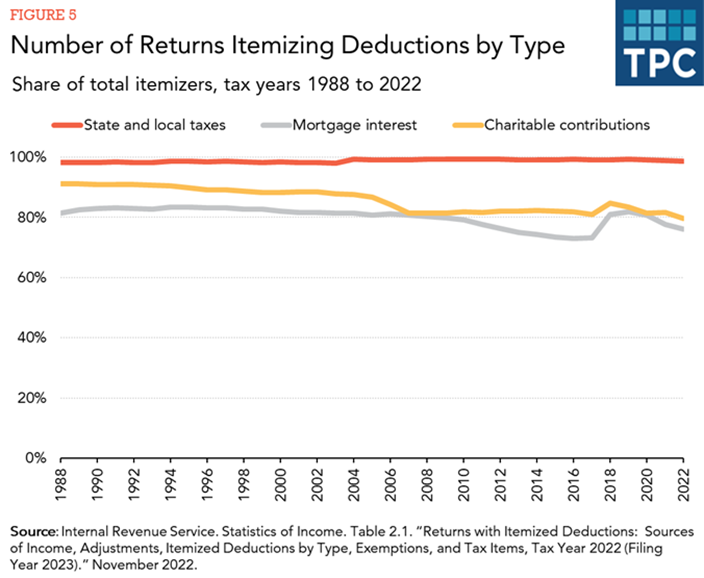
A change in any one of these deductions affects the overall number of itemizers. For example, a decline in home mortgage interest might be enough to discourage a taxpayer from itemizing at all. Thus, the number of taxpayers itemizing state and local taxes or charitable contributions would also decrease.
Updated September 2025
Joint Committee on Taxation. 2001. Study of the Overall State of the Federal Tax System and Recommendations for Simplification, Pursuant to Section 8022(3)(B) of the Internal Revenue Code Of 1986. Vol. 2. JCS-3-01 [Individual income tax proposals 5, 6, 7, and 10]. Washington, DC.
President’s Advisory Panel on Federal Tax Reform. 2005. Simple, Fair, and Pro-Growth: Proposals to Fix America’s Tax System. [Chapters 3 and 5]. Washington, DC.
Toder, Eric and Daniel Berger. 2019. “Distributional Effects of Individual Income Tax Expenditures After the 2017 Tax Cuts and Jobs Act.” Tax Policy Center. Washington, DC.