Municipal bonds (a term that encompasses both state and local government debt) are obligations that entitle owners to periodic interest payments plus repayment of principal at a specified date. States and localities (cities, townships, counties, school districts, and special districts) issue bonds primarily to pay for large, expensive, and long-lived capital projects.
State and local governments issue bonds to pay for large, expensive, and long-lived capital projects, such as roads, bridges, airports, schools, hospitals, water treatment facilities, power plants, courthouses, and other public buildings. Although states and localities can and sometimes do pay for capital investments with current revenues, borrowing allows them to spread the costs across multiple generations. Future project users bear some of the cost through higher taxes or tolls, fares, and other charges that help service the debts.
States and localities issue short-term debt or notes to help smooth uneven cash flows (e.g., when tax revenues arrive in April, but expenditures occur throughout the year). They also issue debt on behalf of private entities (e.g., to build projects with public benefits or for so-called public-private partnerships).
How Large is the Market for Municipal Bonds?
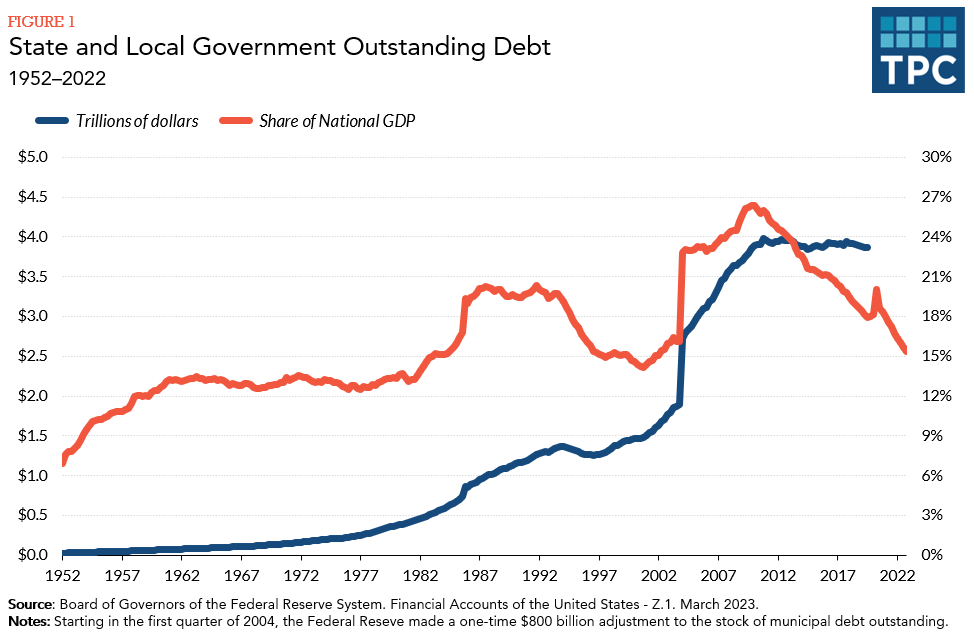
At the end of 2022, state and local governments had $4.01 trillion in debt outstanding (figure 1). About 97 percent of this debt was long term or with a maturity of 13 months or longer, while the remaining 3 percent was short term. As in most years, roughly 40 percent of municipal debt was issued by states and 60 percent by local governments.
Although municipal debt has more than tripled in nominal terms since the mid-1980s, the change is less dramatic as a percentage of the nation’s gross domestic product.

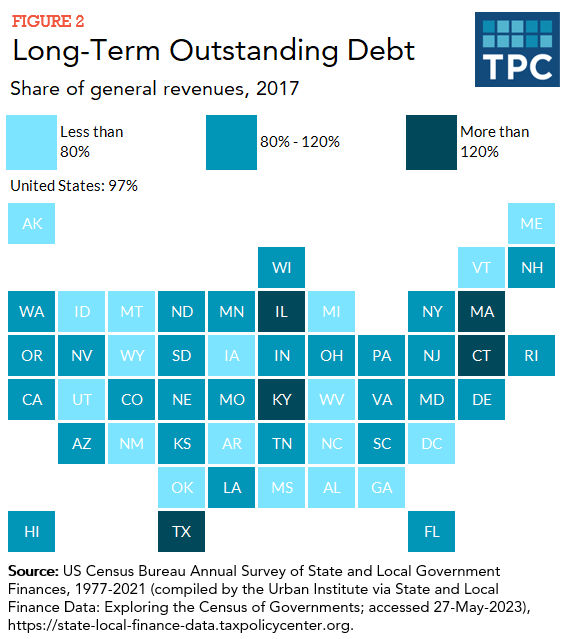
As a share of state and local general revenue, long-term outstanding debt across all 50 states and the District of Columbia was 97 percent in 2017. Wyoming (24 percent), Idaho (50 percent), and Mississippi (55 percent) had the lowest debt as a share of their respective general revenues, whereas Illinois (129 percent), Texas (126 percent), and Massachusetts (123 percent) had the highest debts (figure 2).

What are the Main Types of State and Local Government Debt?
General obligation bonds are backed by an issuer’s “full faith and credit,” including its power to tax. Bonds may also be secured by future revenue streams, such as dedicated sales taxes or tolls and other user charges generated by the project being financed.
General obligation bonds typically require voter approval and are subject to limits on total debt outstanding. Revenue bonds and bonds secured by anticipated legislative appropriations are not subject to these requirements or limits. In 2018, roughly 58 percent of state and local issuances were revenue bonds, 36 percent were general obligation bonds, and 6 percent were private placements.
Who Holds State and Local Government Debt?
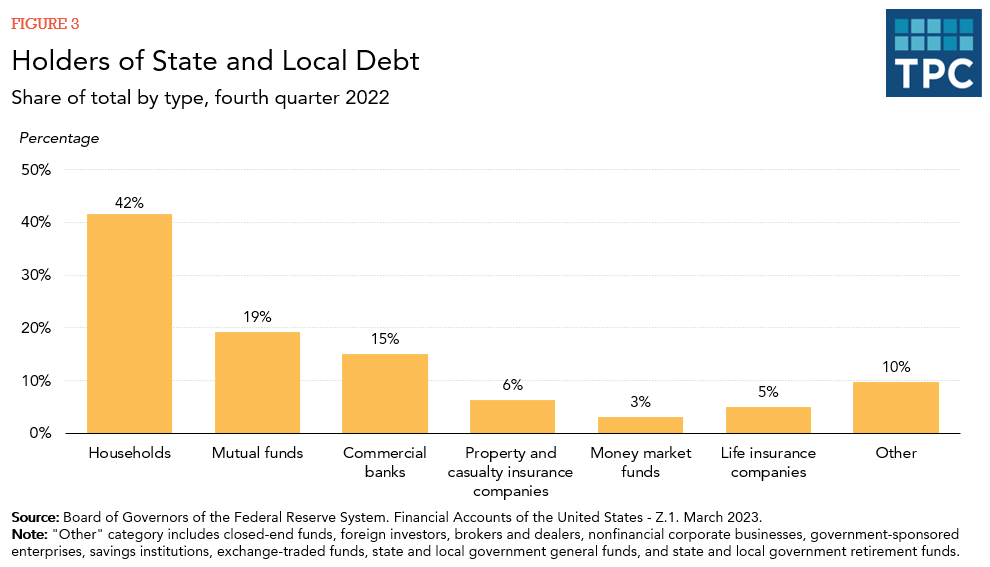
Most state and local bonds are held by households, followed by mutual funds (which also represent household investors) (figure 3). Banks and life insurance companies used to be more prominent municipal bond holders until the Tax Reform Act of 1986 and subsequent litigation limited the tax benefits of doing so.

History of the Federal Tax Exemption for Municipal Bonds
Since its inception in 1913, the federal income tax has exempted interest payments received from municipal bonds from taxable income. State and local governments also typically exempt interest on bonds issued by taxpayers’ state of residence. In 2008, the US Supreme Court in Department of Revenue of Ky. v. Davis upheld states’ ability to tax interest on bonds issued by other jurisdictions.
Because of the federal tax exemption, state and local governments can borrow more cheaply than other debt issuers, such as corporations, for a given level of risk and length of maturity. The federal tax exemption therefore functions as a federal subsidy to state and local public infrastructure investment. This subsidy, which the Joint Committee on Taxation refers to as the exclusion of interest on public purpose state and local government bonds, is estimated to have cost $27 billion in forgone tax revenues in 2022.
The federal tax exemption has been criticized as inefficient because high-bracket taxpayers receive a larger tax subsidy than the amount needed to purchase municipal bonds.
Updated January 2024
Congressional Budget Office and Joint Committee on Taxation. 2009. “Subsidizing Infrastructure Investment with Tax-Preferred Bonds.” Washington, DC.
Galper, Harvey, Kim Rueben, Richard Auxier, and Amanda Eng. 2014. “Municipal Debt: What Does It Buy and Who Benefits?.” National Tax Journal 67 (4): 901–24.
Gordon, Tracy. 2011. “Buy and Hold (on Tight): The Recent Muni Bond Rollercoaster and What It Means for Cities.” Washington, DC: Urban Institute.
Maguire, Steven. 2012. “Tax-Exempt Bonds: A Description of State and Local Government Debt.” RL30638. Washington, DC: Congressional Research Service.
Office of Management and Budget. 2017. Analytical Perspectives: Budget of the United States Government, Fiscal Year 2018. Washington, DC: Office of Management and Budget.
Poterba, James M., and Verdugo, Arturo Ramírez. 2011. “Portfolio Substitution and the Revenue Cost of the Federal Income Tax Exemption for State and Local Government Bonds.” National Tax Journal 64 (2): 591–614.
Securities and Exchange Commission (SEC). 2012. “Report on the Municipal Securities Market.” Washington, DC: SEC.
US Government Accountability Office (GAO). 2012. “Municipal Securities: Overview of Market Structure, Pricing, and Regulation.” Washington, DC: US GAO.
Zimmerman, Dennis. 2005. “Tax Exempt Bonds.” in The Encyclopedia of Taxation and Tax Policy, 2nd ed., edited by Joseph J. Cordes, Robert D. Ebel, and Jane G. Gravelle, 404–406. Washington, DC: Urban Institute Press.