The federal government distributes grants to states and localities for many purposes. Some grants are delivered directly to these governments, but others are “pass-through” grants that first go to state governments, who then direct the funds to local governments. Some federal grants are restricted to a narrow purpose, but block grants give governments more latitude in spending decisions and meeting program objectives. Regardless of type, the bulk of all federal grants are related to health care.
The federal government directly transferred $988 billion to state governments and $133 billion to local governments in 2021. These funds accounted for 18 percent of the federal government’s budget in fiscal year 2021, and 27 percent of combined state and local governments’ general revenues. The total amount transferred directly to state governments was significantly higher than the amount transferred directly to local governments because the state total includes “pass-through” grants, which are federal dollars sent directly to states but ultimately intended for local governments.
For example, the federal government sends elementary and secondary education funds to state governments, and then state governments transfer much of that money to the local governments that ultimately spend the dollars on education programs. Overall, state governments transferred $621 billion to local governments in 2021, but we cannot report how much of that total originally came from the federal government because Census data does not connect intergovernmental expenditures with their original revenue source.
What the Federal Grants to State and Local Governments Pay For
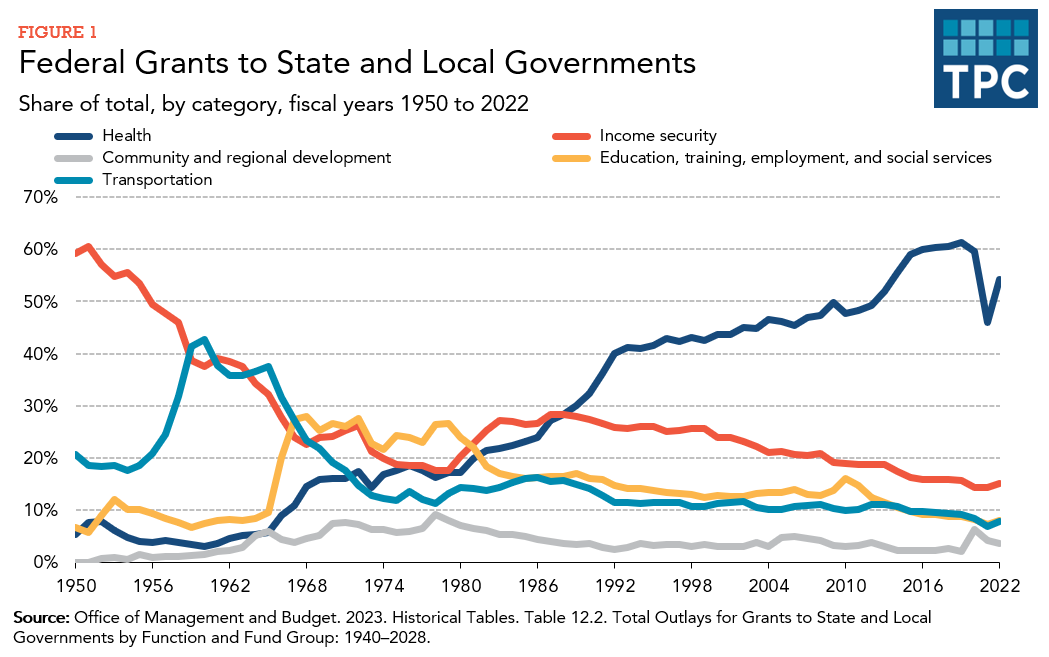
In recent years, roughly 50 to 60 percent of federal grants to state and local governments were dedicated to healthcare spending, including Medicaid (a program jointly funded by the federal and state governments). Another 15 percent went to income security programs and around 10 percent each went to community and regional development; transportation; and education, training, employment, and social services.
Over the past 50 years, the composition of federal grants has shifted dramatically (figure 1). Most notably, federal grants for health care programs grew from less than 20 percent of the total before 1980 to 61 percent at its peak in 2019. However, this largely reflects increased spending on health care during the time period and not a shift of government priorities. For example, transfers related to health care increased from $52 billion in 1980 to $469 billion in 2019, in inflation-adjusted dollars, while transfers for income security (which dropped as a share of spending during the period) also increased from $61 billion to $119 billion.
Overall, from 1977 to 2021, in 2021 inflation-adjusted dollars, federal transfers to state and local governments increased from $279 billion to $1.1 trillion, a 301 percent increase. Real per capita federal transfers increased from $1,271 to $3,374, a 165 percent increase.

Looking at total spending instead of share of spending, annual increases in federal grants are typically low. For example, aid increased 3 percent in inflation-adjusted dollars between 2018 and 2019. However, as the federal government responded to the COVID-19 pandemic, federal transfers to state and local governments increased 18 percent in real inflation-adjusted dollars between 2019 and 2020, and 17 percent between 2020 and 2021. In general, federal transfers typically spike in response to recessions and other major shocks to the economy. The previous high of 35.5 percent in 2010 marked increased federal aid to states and drops in state revenue following the Great Recession. In inflation-adjusted dollars, federal grants increased 13 percent between 2008 and 2009, and 14 percent between 2009 and 2010.
How Federal Grants Work
The federal government distributes grants to state and local governments for several reasons. In some cases, the federal government may want state and local governments spending funds because they have better information about local preferences and costs, and thus are better situated to implement programs on the ground. In others, the federal government may use funds to offer states and localities incentives to spend on programs that achieve specific goals or benefit regions beyond their jurisdiction (e.g., a new transportation project that might benefit multiple states).
Related, there are two main types of federal grants: categorical grants and block grants.
Categorical grants are restricted to a narrow purpose, such as providing nutrition under the Special Supplemental Nutrition Program for Women, Infants, and Children, also known as WIC. Even more restricted are grants limited to specific projects, such as building a highway.
In contrast, block grants give governments more latitude in spending and meeting program objectives. For example, states set eligibility requirements within federal parameters for the Temporary Assistance for Needy Families (TANF) program.
Until 1986, the federal government’s General Revenue Sharing Program used grants to redistribute resources across states.
Federal grants may also be classified according to how funds are awarded. Formula grants allocate federal dollars to states based on formulas set in law and are linked to factors such as the number of highway lane miles, school-aged children, or low-income families. A prime example is the federal-state Medicaid program, which provides subsidized health insurance to low-income households. Grants may also be awarded competitively according to specified criteria, as in the Race to the Top or Transportation Investment Generating Economic Recovery awards.
In addition, grants may require states and localities to contribute their own funds (matching requirements) or maintain previous spending despite the infusion of federal cash (maintenance-of-effort requirements).
A recurring question with federal grants is how they influence state and local behavior. Some research finds that states and localities reduce their own spending and use federal dollars as a substitute, but other research finds evidence that federal dollars stimulate additional state and local spending.
Beyond grants, the federal government also subsidizes state and local governments by allowing federal income taxpayers to deduct state and local taxes already paid (up to a $10,000 cap in 2018 through 2025 under current law) and by excluding bond interest from taxable income. Per the Joint Committee on Taxation, the value of these subsidies was about $44 billion in forgone tax revenues in 2022.
Federal Transfer Amounts Differ Across States
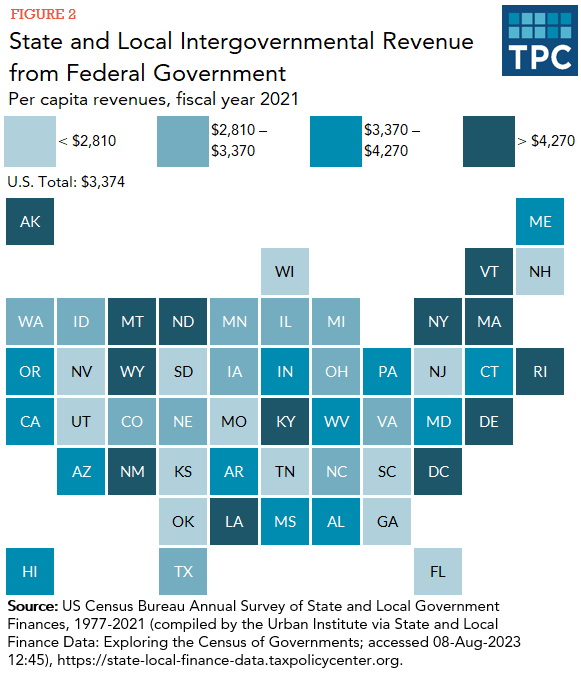
State and local governments received $3,374 per capita in federal transfers in 2021, but totals vary widely across states.
Among the states, Alaska ($7,618) received the most per capita federal dollars in 2021, followed by Rhode Island ($6,016), New Mexico ($5,953), and Wyoming ($5,926). In contrast, Florida received the least federal revenue per person in 2021 ($2,375), followed by Kansas ($2,426), Nevada ($2,463), Wisconsin ($2,548), and South Dakota ($2,575).

Data: View and download each state's per capita intergovernmental revenues
[The District of Columbia received $9,436 in per capita federal transfers. However, the District is often an outlier because, although it functions as a state and a locality, it most closely resembles a central city in terms of its population and economic activity. Its total compared to other states should be interpreted within this context.]
Many federal grants are allocated to state and local recipients by population-based formulas. Some formulas use other factors like miles of transportation infrastructure, poverty, share of unemployment, and others in order to allocate dollars in proportion to need. Certain programs use matching formulas to determine the federal government’s share of program expenditures—states must contribute certain levels of their own funds, so federal dollars received could indicate which states have greater own-source resources.
However, in the case of Medicaid, the largest source of federal aid to states, higher expenditures can indicate higher need in the state as well as higher costs. For all these reasons, comparing states’ federal receipts on a per capita basis does not always provide clear conclusions.
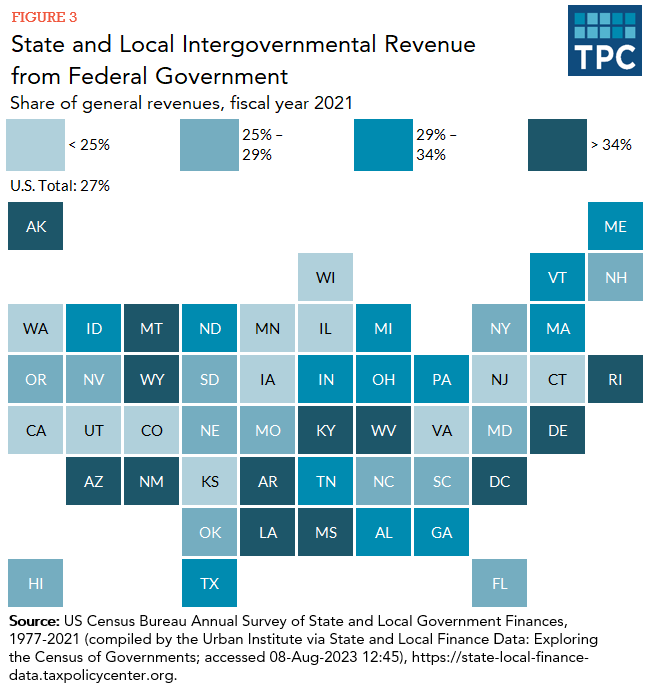
An alternative is to look at federal aid as a portion of general revenues across states. On average, transfers from the federal government made up 27 percent of state and local general revenues, ranging from 42 percent in Montana to 21 percent in New Jersey and Kansas. States with the highest levels of state aid as a share of general revenues include New Mexico and Rhode Island (each 41 percent), and Alaska and Louisiana (each 40 percent). States with the lowest levels of state aid as a share of general revenues include Utah (22 percent) and California and Iowa (each 23 percent).

Updated January 2024
Airi, Nikhita. 2021. Tracking Federal Economic Recovery Funds to Communities: A Guide for Local Governments, Advocates, and Community-Based Organizations. Washington, DC: Urban Institute.
Randall, Megan, Tracy Gordon, Solomon Greene, and Erin Huffer. 2018. Follow the Money: How to Track Federal Funding to Local Governments. Washington, DC: Urban Institute.
Congressional Budget Office. 2013. Federal Grants to State and Local Governments. Washington, DC.
Congressional Research Service. 2019. Federal Grants to State and Local Governments: A Historical Perspective on Contemporary Issues. Washington, DC.
Gordon, Tracy. 2020. Strengthening the Federal-State-Local Partnership in Recession and Recovery. Testimony before the Committee on the Budget, US House of Representatives. Washington, DC: Urban-Brookings Tax Policy Center.
Leduc, Sylvain, and Daniel Wilson. 2017. Are State Governments Roadblocks to Federal Stimulus? Evidence on the Flypaper Effect of Highway Grants in the 2009 Recovery Act. American Economic Journal: Economic Policy 9 (2): 253–92.