A value-added tax (VAT) is a tax on consumption. Poorer households spend a larger proportion of their income. A VAT is therefore regressive if it is measured relative to current income and if it is introduced without other policy adjustments. A VAT is less regressive if measured relative to lifetime income.
Although a value-added tax (VAT) taxes goods and services at every stage of production and sale, the net economic burden is like that of a retail sales tax. Sales taxes create a wedge between the price paid by the final consumer and what the seller receives. Conceptually, the tax can either raise the total price (inclusive of the sales tax) paid by consumers or reduce the amount of business revenue available to compensate workers and investors. Theory and evidence suggest that the VAT is passed along to consumers via higher prices. Either way, the decline in real household income is the same regardless of whether prices rise (holding nominal incomes constant) or whether nominal incomes fall (holding the price level constant).
Regressivity
Because lower-income households spend a greater share of their income on consumption than higher-income households do, the burden of a VAT is regressive when measured as a share of current income: the tax burden as a share of income is highest for low-income households and falls sharply as household income rises. Because income saved today is generally spent in the future, the burden of a VAT is more proportional to income when measured as a share of income over a lifetime. Even by a lifetime income measure, however, the burden of the VAT as a share of income is lower for high-income households than for other households. A VAT (like any consumption tax) does not tax the returns (such as dividends and capital gains) from new capital investment, and income from capital makes up a larger portion of the total income of high-income households.
Average Tax Burden
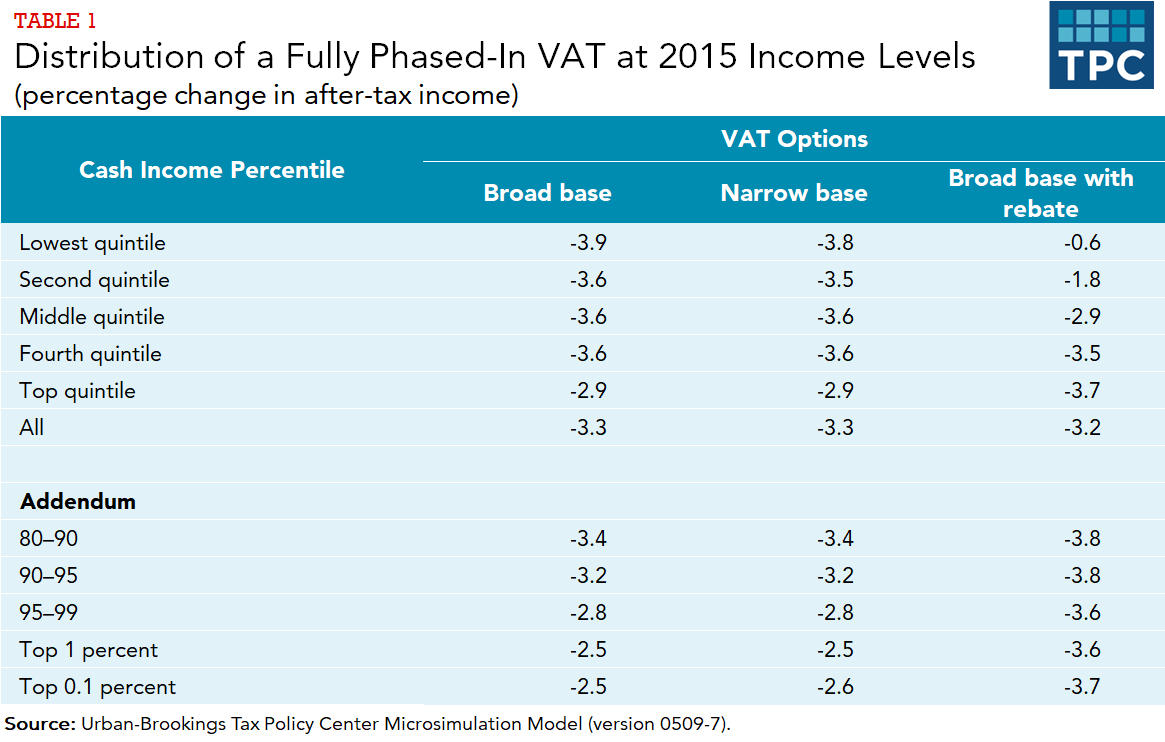
Using a method more reflective of lifetime burdens, Eric Toder, Jim Nunns, and Joseph Rosenberg (2012) estimate that a 5 percent, broad-based VAT would be regressive at the bottom of the income distribution, roughly proportional in the middle, and then generally regressive at the top. The VAT would impose an average tax burden of 3.9 percent of after-tax income on households in the bottom quintile of the income distribution. (Each quintile contains 20 percent of the population ranked by income.) Yet, households in the top 1 percent of the income distribution would only have an average tax burden of 2.5 percent (table 1).

Demogrants
Exempting, zero rating, or excluding certain essential consumption goods from the tax base (e.g., foodstuffs, medicine, health care) can reduce the regressivity of a VAT. Giving preferential treatment to particular goods, however, is an inefficient way to make the tax less regressive because high-income households consume more of the goods in question (though less as a share of income) than low-income households do. A better approach is to provide a limited cash payment—that is, a demogrant or a refundable tax credit. That way, everyone receives the same benefit, in dollars, which translates into a larger share of low-income households’ income.
In the same study, Toder, Nunns, and Rosenberg simulate the effects of a 7.7 percent broad-based VAT with a refundable tax credit (the higher tax rate keeps the net revenues the same as the 5 percent, broad-based VAT with no tax credit). They find that the VAT in combination with the tax credit would impose an average tax burden of 0.6 percent on households in the bottom quintile of the income distribution. Households in the top 1 percent of the income distribution would face an average tax burden of 3.6 percent. Their results also show that the distribution of a narrow-based VAT that excludes spending on food, housing, and health care is much the same as the distribution of a broad-based tax (table 1).
Benedek, Dora, Ruud A. de Mooji, and Philippe Wingender. 2015. “Estimating VAT Pass Through.” Working Paper 1/214. Washington, DC: International Monetary Fund.
Tax Analysts. 2011. The VAT Reader: What a Federal Consumption Tax Would Mean for America. Falls Church, VA: Tax Analysts.
Toder, Eric, Jim Nunns, and Joseph Rosenberg. 2012. “Implications of Different Bases for a VAT.” Washington, DC: Urban-Brookings Tax Policy Center.