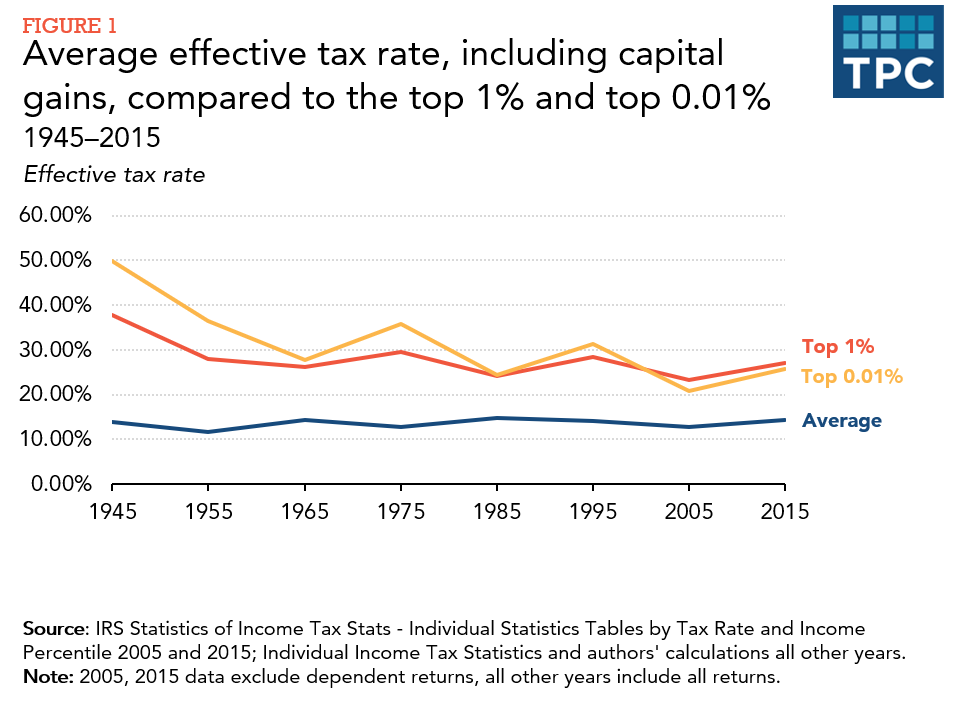
While average effective tax rates barely changed in the US from 1945 to 2015, the average tax rates of high-income households fell sharply—from about 50 percent to 25 percent for the highest income 0.01 percent and from about 40 percent to about 25 percent for the top 1 percent.
Our measure of effective tax rates divides total personal income tax by adjusted gross income (AGI) plus capital gains that were realized but untaxed. We calculated the effective tax rates for the top 1 percent and the top 0.01 percent, and the effective tax rate averaged over all tax filers (Figure 1). From 1945 through 1965, rates for taxpayers with the highest 1 percent and 0.01 percent of AGI fell. Due in part to the Tax Reform Act of 1969, rates on both the top 1 percent and top 0.01 percent rose by 1975, but then fell back to about 25 percent by 1985. Although the rates rose and fell after that, they remained at about 25 percent from 1985 to 2015.

By contrast, average effective tax rates across all taxpayers were remarkably stable throughout the 1945 to 2015 period, and only varied between 12 and 15 percent. Adding untaxed capital gains back to income barely affects average effective tax rates because capital gains are disproportionately earned by higher-income individuals and represent less than 10 percent of income for people in the bottom 80 percent of the income distribution.
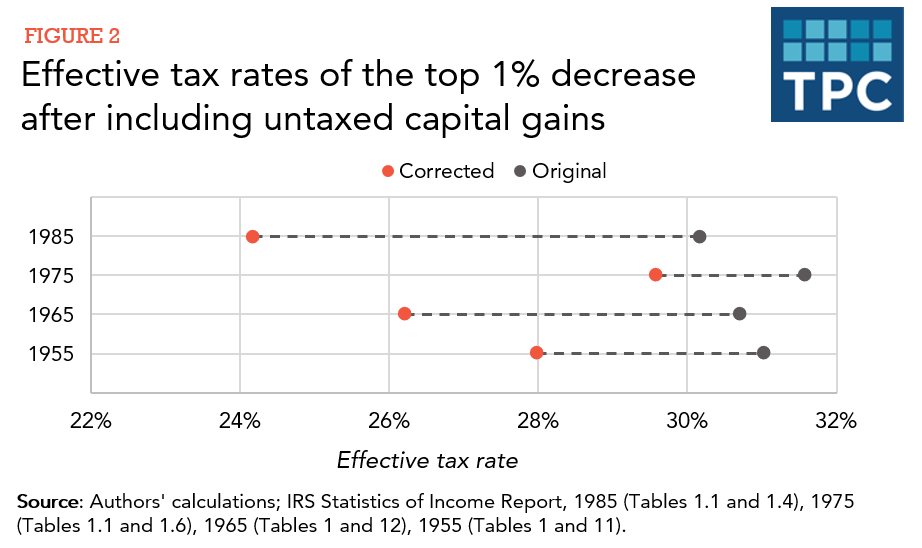
Our new analysis updates and revises calculations we made in 2019. But that study did not fully include all capital gains for the years before 1990. The problem: We implicitly assumed that adjusted gross income (AGI) is a relatively stable measure of income over time. However, because Congress changed the way it treated the taxation of capital gains—from various exclusions before 1986 to lower tax rates after 1991—only part of capital gains counted towards AGI before the Tax Reform Act of 1986. From 1986 through 1991, all capital gains were taxed at the same rate as ordinary income. Since 1992, long-term gains have been taxed at rates well below ordinary income. Properly accounting for capital gains lowered the effective tax rates for the top 1 percent by up to 6 percentage points (Figure 2).

Making that correction shows the tax system still was progressive – meaning that effective tax rates tend to go up with income. But the effective tax rates for top earners in the earlier years were lower than our first calculations suggested, which means that there has been less of a decline in effective tax rates than our earlier post suggested. Although not shown here, in the original post we showed that effective rates continued to increase further up the income distribution while using the corrected data those rates do not appreciably increase for those with higher incomes.
Debates over measuring effective tax rates have been lively because measuring taxes and incomes is complex and involves judgement calls (and the political stakes are high.) We applied a simple and replicable method to a single, publicly available source of data to estimate the effective tax rates of high-income taxpayers that avoids making assumptions about grey areas like unrealized capital gains and corporate tax burdens. As our mis-step shows, even in the simplest cases, errors are possible. But using our method, effective tax rates on high-income taxpayers are lower now than in the past.
