This post is part of the Tax Policy Center’s series, Tax Line, which digs into the data behind the day’s most pressing tax policy issues. You can read all posts in this monthly series by clicking on the topics tag, TaxLine, at the bottom of this post.
Capital gains have a significant effect on the pattern of average income tax rates across the income distribution and over time because of four special features:
- Preferential rates. Capital gains (and qualified dividends since 2003) are taxed at lower rates than other (“ordinary”) income.
- Ownership pattern. Ownership of capital gains assets is highly concentrated at the highest income levels.
- Volatility. Most capital gains are generated from sales of stock and stock markets are more volatile than the economy as a whole. This makes capital gains more volatile over time than other sources of income.
- Not taxed until realized. Investors are taxed only after they choose to sell assets. They may delay sales or time them to offset taxable gains with losses. They may also accelerate the sale of capital assets if they foresee a tax increase the following year.
New data from the Statistics of Income (SOI) Division of the IRS illustrate these special features of capital gains. Graduated tax rates should result in average income tax rates that increase with income, and in every year they do except at the very top of the income distribution (figure 1). The average tax rate of the very highest income taxpayers (the top 1 in 10,000 taxpayers, or 0.01 percent) is lower than for the next highest group (the top 99 percent to 99.99 percent).

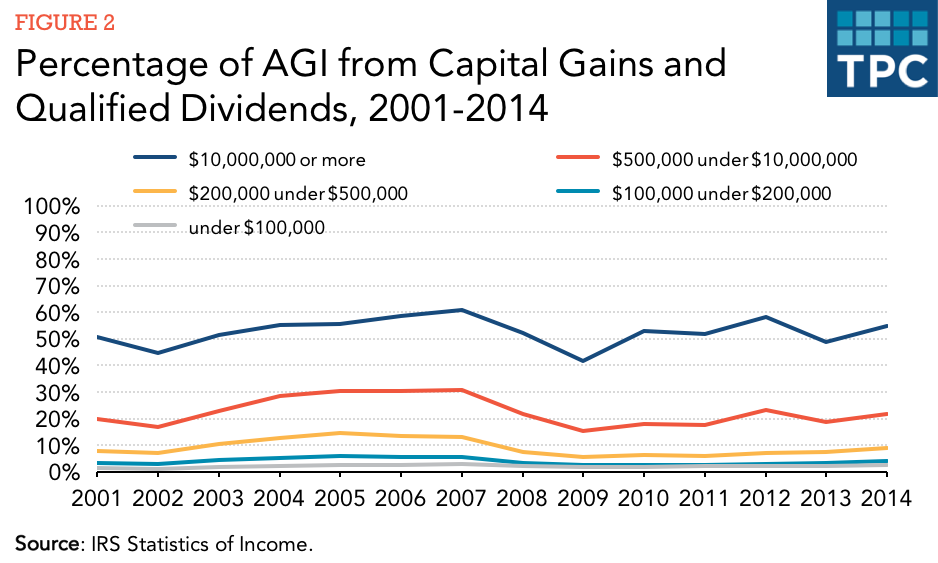
Average tax rates fall at the very top because such a large share of this group’s income is from preferentially-taxed capital gains and qualified dividends (figure 2). Taxpayers with AGI over $10 million (roughly the top 0.01 percent) received more than half of their income (52.6 percent) from capital gains and qualified dividends over the 2001-2014 period. However, for taxpayers making between $500,000 and $10 million (roughly the highest 99 percent to 99.99 percent of the income distribution), such investment income represented only 22.6 percent of their AGI. Taxpayers with AGI below $500,000 (roughly the bottom 99 percent), received a relatively small share of their income from capital gains and dividends. Thus, taxes on this investment income did not substantially affect their average tax rates.

The years 2001-2014 saw dramatic shifts in the economy as well as major changes in tax rates at the beginning and end of the period. As a result, the pattern of income and taxes was highly variable within that 15-year window.
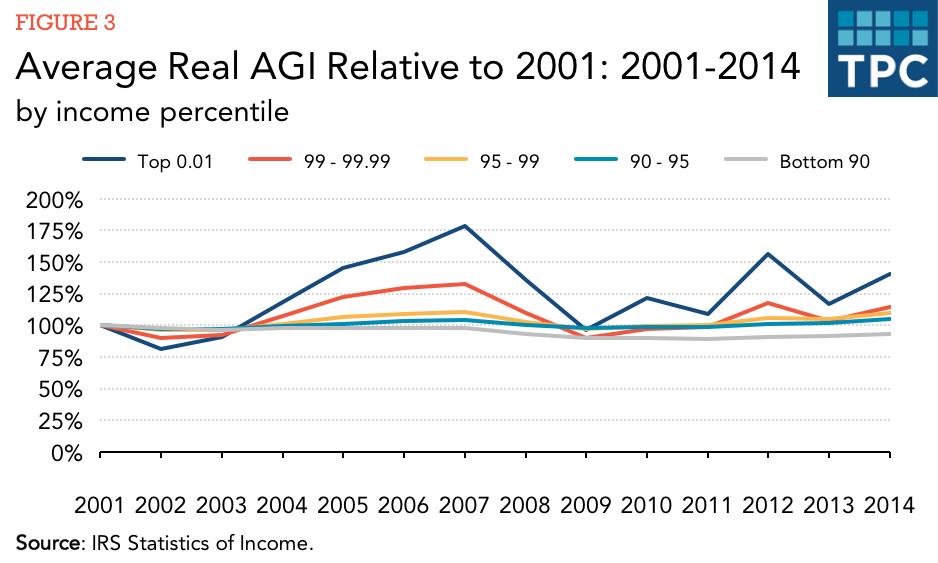
2001-2003. Average income tax rates fell at all income levels, due to the phase in of lower rates on ordinary income enacted in 2001, and further reductions in the preferential rates on capital gains enacted in 2003. Average tax rates also fell due to an increase in the share of income from capital gains and qualified dividends (figure 2), and a reduction in average real incomes due to the effects of the 2001 recession (figure 3).
2004-2007. Average income tax rates fell for the top 1 percent, but increased, at least modestly, for the bottom 99 percent. Average real incomes grew at all income levels (figure 3), which by itself would lead to higher average tax rates due to real bracket creep. However, lower tax rates on capital gains and qualified dividends and a large increase in the share of income from these sources more than outweighed the effects of real bracket creep in every year for the top 1 percent.

2008-2009. Average income tax rates increased for the top 1 percent but fell for the bottom 99 percent, reversing the pattern for 2004-2007. The “great recession” reduced average real incomes at all income levels (figure 3), which generally lead to reduced average income tax rates. But for the top 1 percent, the significant decline in the share of income from capital gains and qualified dividends (figure 2) had a larger effect.
2010-2012. Average income tax rates fell for the top 1 percent but increased for the bottom 99 percent, the same pattern as in 2004-2007. Much of the increase in capital gains realizations by the top 1 percent occurred in 2012, apparently in an effort to accelerate gains before higher tax rates became effective in 2013 (figure 2).
2013-2014. Average income tax rates increased, at least modestly, for all income levels. Average real incomes increased for the bottom 99 percent, but were slightly lower in 2014 than in 2012 for the top 1 percent. However, the share of income from capital gains and qualified dividends fell enough for the top 1 percent to outweigh the effects of the small decline in real incomes.
