In a new paper, we show that more than half of the income generated by closely held businesses (that is, firms other than corporations) goes untaxed. Addressing this gap could yield substantial revenue gains in addition to allowing policymakers to tax the wealthy more effectively, a frequently repeated though so far often elusive goal.
A pure income tax would tax all income. While that ideal does not exist in the US revenue system, it is useful to understand why so much business income is untaxed as well as the revenue and distributional effects of taxing that income.
In a separate paper, we describe how we estimate income tax liabilities with the public-use Survey of Consumer Finances (SCF) micro data in conjunction with the National Bureau of Economic Research’s TAXSIM model. Tax data alone are insufficient to fully understand these issues because the income reported on tax forms already is reduced by laws, avoidance strategies, and noncompliance.
We found that while the income businesses report in the SCF is nearly the same as what is reported in the National Income and Product Accounts (NIPA), both are nearly twice what businesses report to the IRS. We believe that SCF respondents disclose how much their businesses actually earned, while the income taxpayers report to the IRS can include substantial paper losses even when a business generates profits for its owners. Given this hypothesis, we ask “what if we could tax that income?”
To test this idea, we first reduce by half the business income reported by owners with positive income in the SCF. This is a simple way to approximate the fact only about half of all closely held NIPA business income shows up on tax forms. If wealthier business owners are more likely to use loss-generating business accounting practices, our approach understates the revenue and distributional effects of taxing all income.
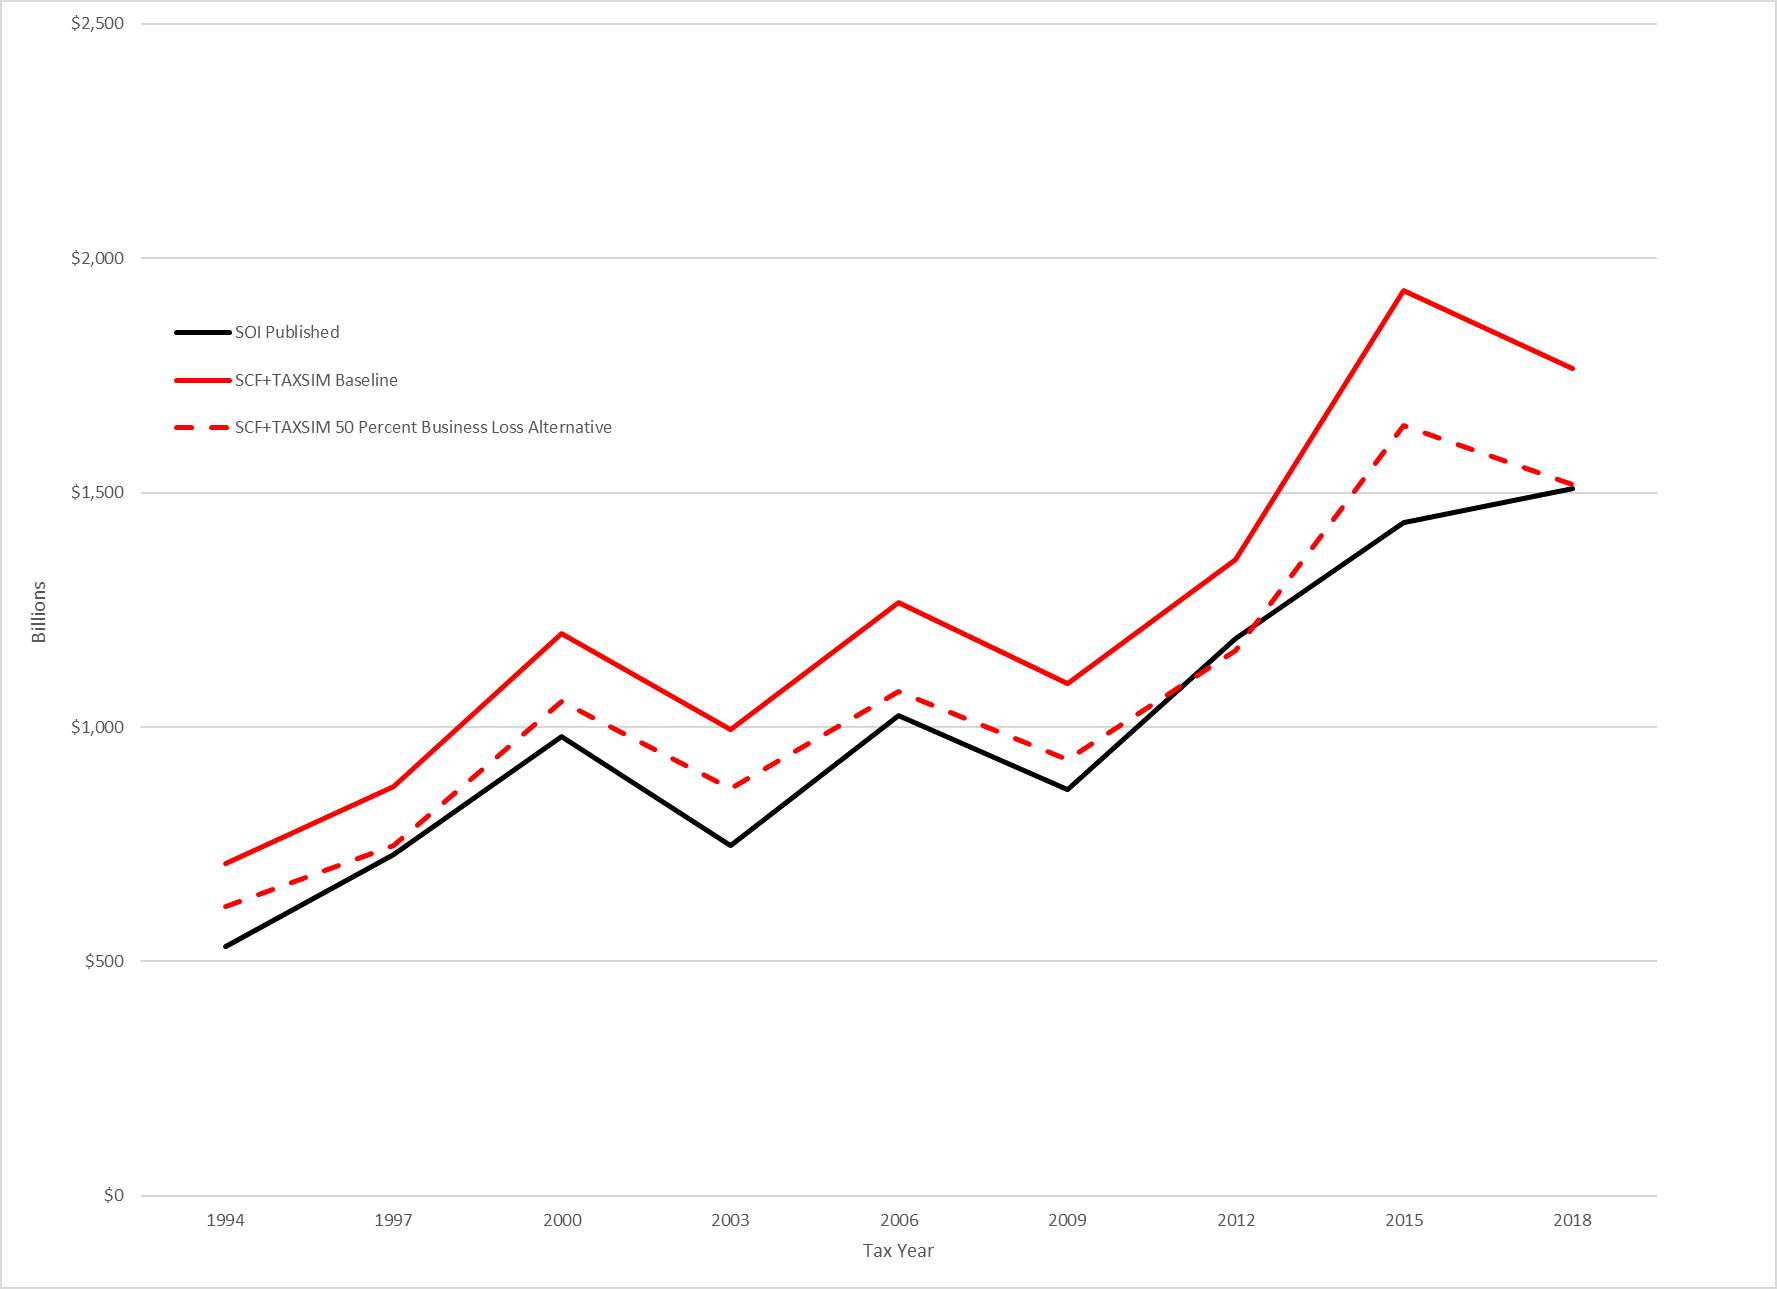
Our conclusion: Business owners would pay far more in taxes based on their SCF+TAXSIM income before the 50 percent shave than they have paid as reflected in SOI values. Most of the higher unadjusted SCF+TAXSIM income is due to greater business incomes.
The gaps between SCF+TAXSIM and actual SOI tax liabilities are relatively stable over time, which is consistent with a systematic reporting difference. Cutting business income by 50 percent closely aligns the SCF+TAXSIM aggregate tax liabilities with the published IRS data.
Because the SCF is a relatively small sample, its data are volatile from year-to-year. Still, the reduced business income simulation aligns well with published SOI over our sample period.
We also found that the distribution of adjusted gross income in the SCF more closely matches published IRS after we reduce business income by half.
Figure 1. Aggregate Tax Liability After Credits, SOI and SCF+TAXSIM

Our unadjusted SCF+TAXSIM simulation also shows a significant difference in the distribution of tax liability. Households with wealth of $10 million or more account for 30.3 percent of taxes in SCF+TAXSIM compared to 27.6 percent based on SOI data. Their average tax liability jumps by 28 percent, from $287,830 to $367,145 for these families.
Finding a way to tax what business owners effectively earn, rather than what they report to the IRS, would have important revenue and distributional implications. And it may be the key to more effectively taxing the wealthy, an idea that has attracted significant attention among policymakers.
