This blog is the third in a four-part series sharing key takeaways from Making Tax Analyses More Effective and Inclusive: A Guide For Analysts.
Numerous government and independent organizations regularly produce rigorous, trusted estimates of how a given proposal will affect different groups of people—often under tight deadlines and with considerable care dedicated to explaining the numbers in ways that support more reasoned and informed public debate.
But tax analysts and policy experts can do more to show how specific tax policy design choices help shape economic outcomes and well-being. Our new guide shares a few options.
1. Link policy design choices to before and after outcomes
Distribution tables showing who would pay more or less under a given proposal—like this one from TPC on 2025’s One Big Beautiful Bill Act (OBBBA)—are the core product for many tax analysts.
This format serves a purpose, but when crafting products for wider audiences, analysts could highlight key takeaways in simpler formats to make the connection between policy design choice and outcome clearer at first glance.
One option: This paired bar chart shows the change in federal tax burden from the baseline (the “before”) to a new or proposed law (the “after”). The title gives the reader an easy takeaway.
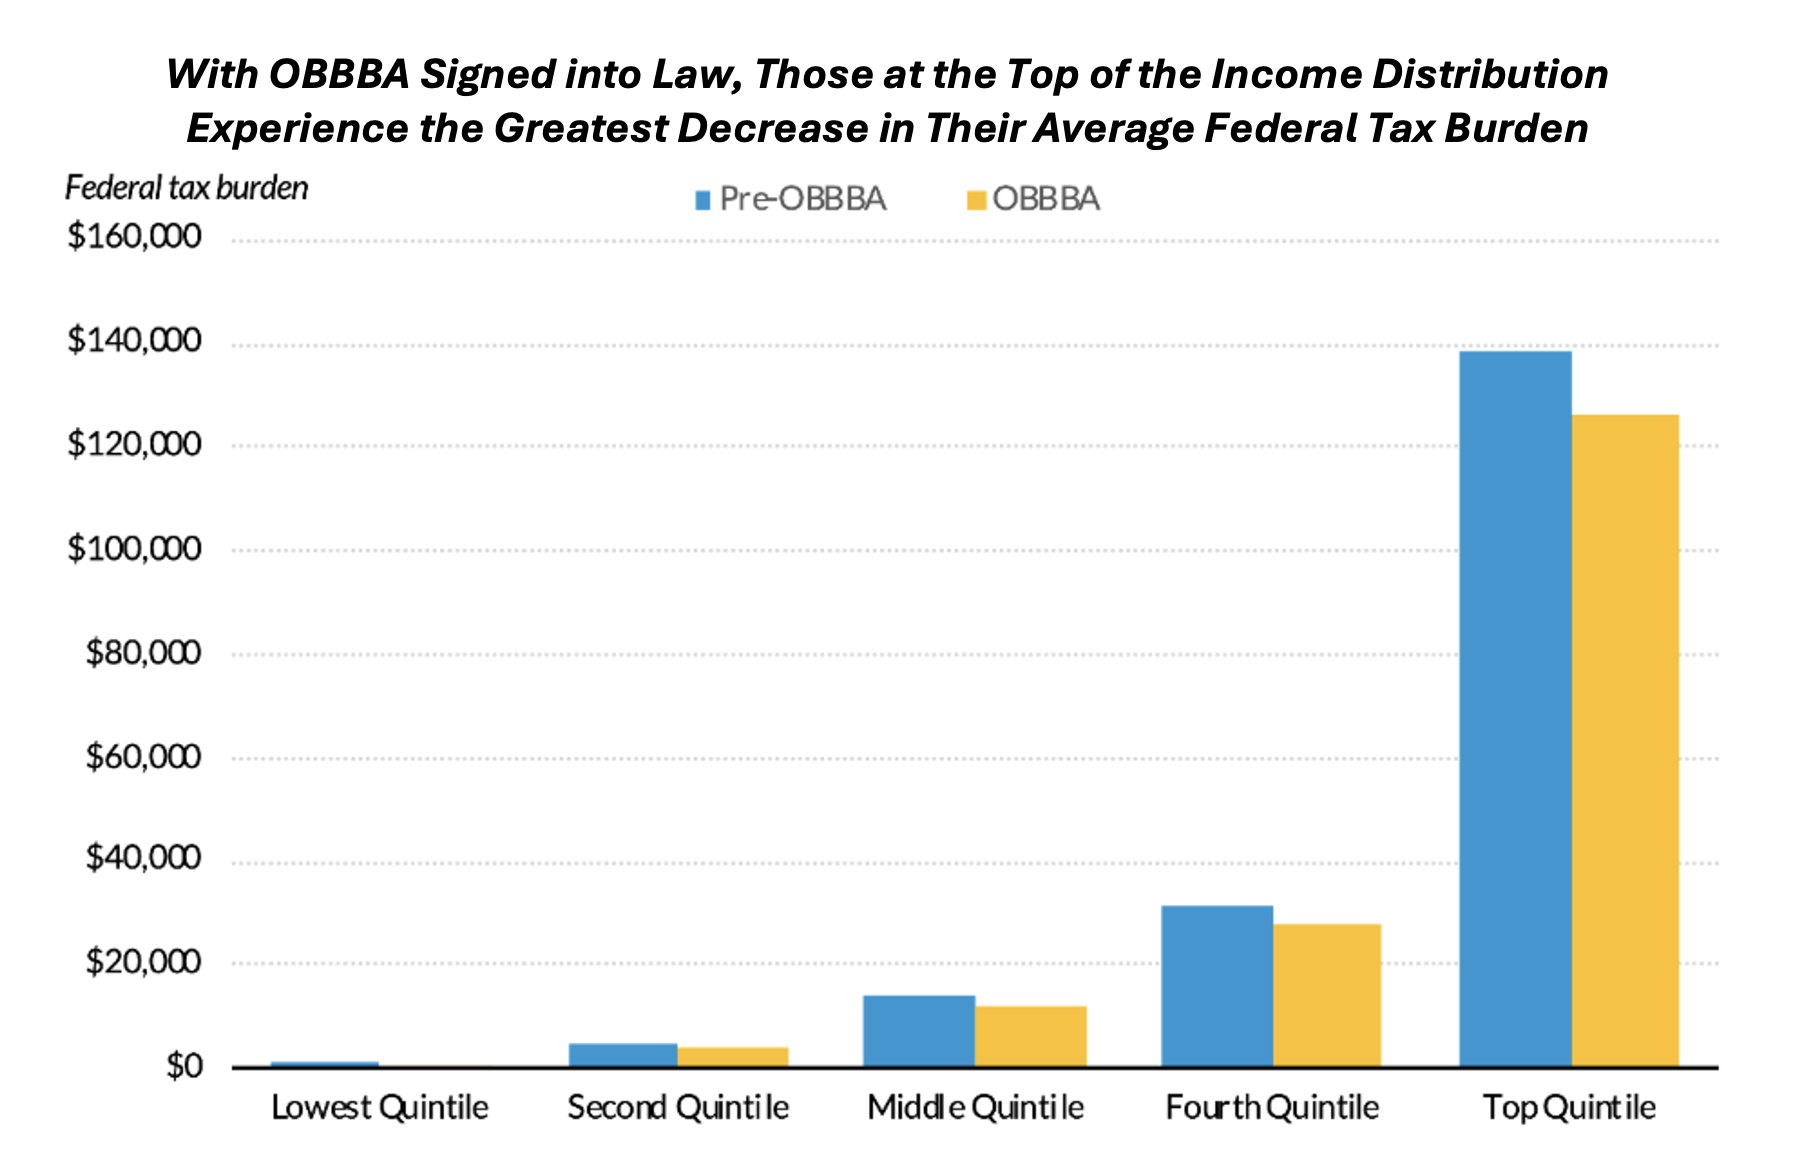
Research shows that general readers are more likely to recall information if it is presented in a visual format. Rather than just statingthe change in income from OBBBA, the bar chart shows the pre-policy baseline to break down who benefits by how much. Whether a member of the public or an analyst, the reader can see the different potential outcomes of a policy on different income groups without examining a detailed distributional table.
2. Ask “What if?” about alternative policy choices
For example, capital gains, which are taxed at a lower rate than ordinary income and disproportionately held by White households, have been a major factor in the widening racial wealth gap since the 1980s. What if tax policy had not provided preferential tax treatment to capital gains relative to wages and salaries? Posing questions about what current distributions could look like if tax policy choices had been different—and conducting rigorous research to answer those questions—is one way to acknowledge the power of tax policy to shape long-run outcomes.
3. Use case studies to make outcomes concrete
To make the relationship between policy design and tax outcomes more evident, analysts can share case studies or real-world examples describing before-and-after impacts on representative households.
This could be as simple as outlining how a tax policy might affect a head of household with a spouse and two children as opposed to a single parent. A “case study” household doesn’t reflect a group average, but it can help tax estimates resonate with readers and help them see how tax policy affects people in different circumstances. An even more straightforward method would translate changes in income into changes in purchasing power, for example how many months of groceries or childcare a taxpayer could afford before and after a tax policy change.
Connecting design to outcomes improves policy understanding
When tax analyses focus narrowly on incremental changes in income without situating them in people’s day-to-day experiences or presenting alternatives, they can miss the very choices that produce today’s outcomes. New kinds of presentations of tax data offer an opportunity to clarify what is at stake, for whom, and why.
