Over the past three decades, the United States has gone from taxing roughly half of closely held business (that is, firms other than corporations) and investment income to taxing less than a third, our new analysis has found.
Rather than using published IRS Statistics of Income (SOI) reports on aggregate incomes shown on tax returns, we relied on economic income data from the National Income and Product Accounts (NIPA) and Financial Accounts of the United States. Tax data alone provide incomplete information because the income recorded on tax forms already is reduced by tax rules, avoidance strategies, and non-compliance.
This new way of looking at income provides a very different perspective on the extent to which income of closely held businesses and investment income is taxed. And that view may be especially useful as Congress debates how best to tax very high-income households.
We group income flows into three categories: closely held businesses; financial incomes such as interest and dividends; and a broad “other” category that includes wages and salaries, pensions, Social Security, and Unemployment Insurance. In sensitivity analyses, we also add capital gains. And we made several technical adjustments to ensure that the NIPA and SOI data represent the same income concept.
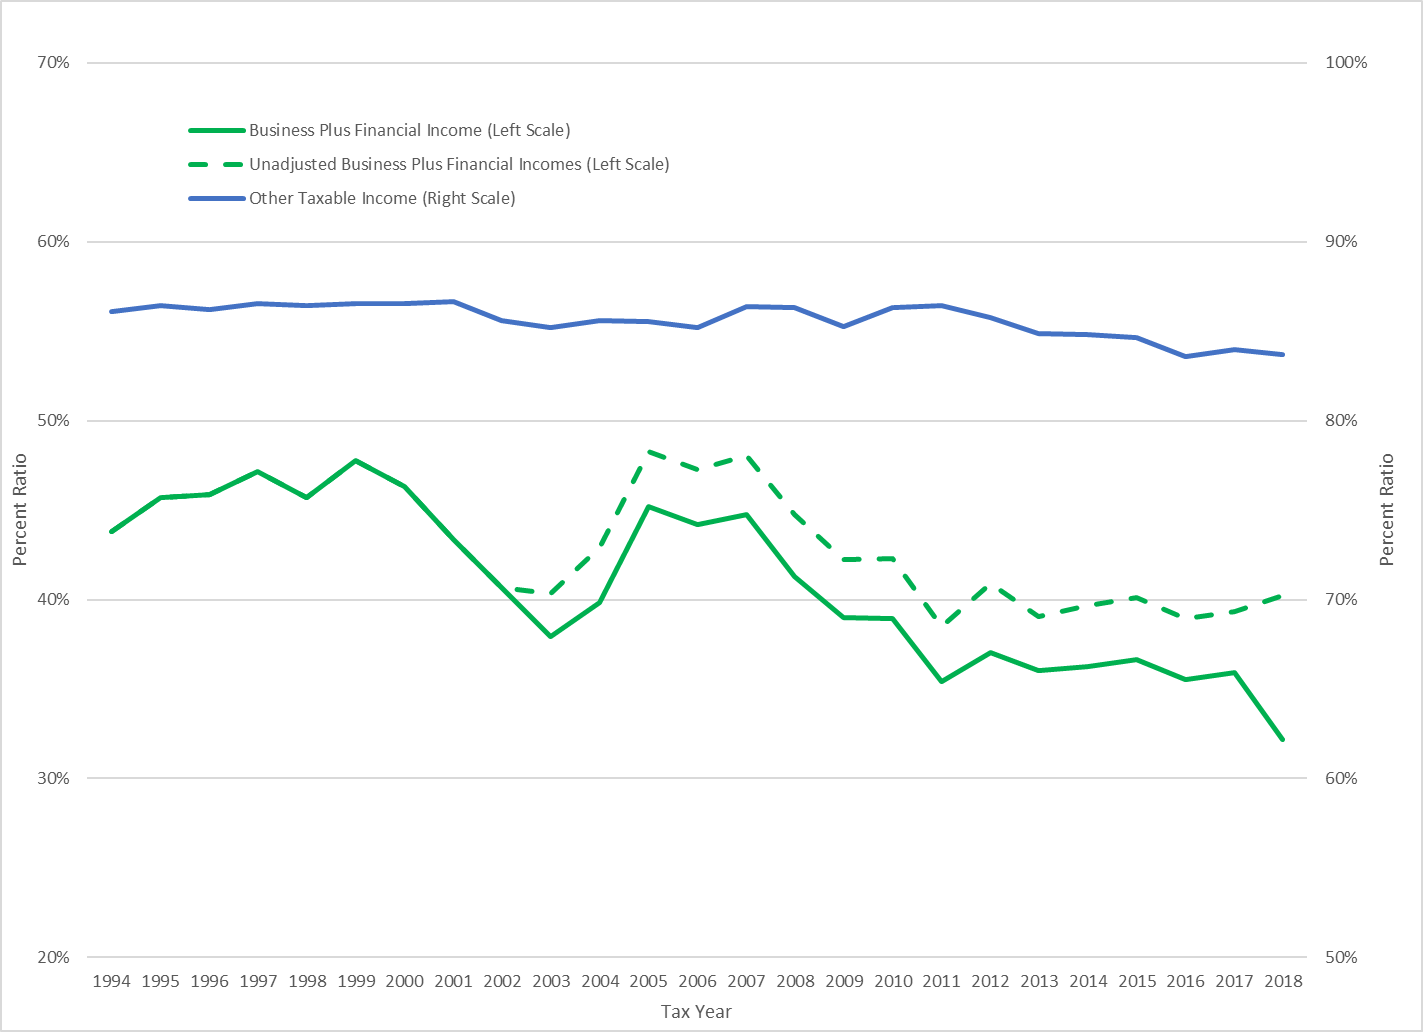
From 1994 to 2018, the ratio of SOI to NIPA measures of “other” income has been high and relatively constant. It was 86 percent in 1994 and 84 percent in 2018, with the small decline occurring in the last few years.
Figure 1. SOI Income Relative to NIPA

In contrast, the ratio of SOI to NIPA measures of income from closely-held businesses and financial income is lower and has declined over time. The nation shifted from taxing about 44 percent of economic measures of business and financial income to taxing 32 percent in 2018. The sharp decline in 2018 is due to the 2017 Tax Cuts and Job Act’s 20 percent deduction for pass-through income (the qualified business income deduction).
Even after we removed our technical adjustments made for qualified dividends (preferential treatment enacted in 2003) and qualified business income, the ratio still fell from 44 percent in 1994 to 40 percent in 2018. Thus, less than half of NIPA income is reported to the IRS by business owners.
Understanding the sources of discrepancy between NIPA and SOI income data—including changing tax laws, non-compliance, and differences in reporting of business losses—can have important implications for measuring and interpreting trends in the distribution of income and wealth.
The large and growing gap between NIPA and SOI measures of income also raises important distributional and revenue questions. For example, which income groups have more of their economic income exempted from taxation? Or how much revenue could be gained from altering the tax base to include more excluded income? We use microeconomic data to answer those questions in a separate paper.
