Starting in early 2025, President Trump expanded tariffs on goods from a wide range of countries under various authorities, including the International Emergency Economic Powers Act (IEEPA). The US Supreme Court in February 2026 struck down IEEPA tariffs. Other tariffs imposed by President Trump, including some dating back to 2018, remain in place.
On July 23, 2026, the United States Trade Representative finalized a broad Section 301 tariff relating to forced labor that covers over 80 trading partners. TPC estimates that these finalized provisions will raise $581 billion over 2026-2036 (less than the draft version of the tariff). The rate varies from 10 to 12.5 percent and is applied preferentially for certain trading partners, many of whom have previously signed a trade agreement with the administration. There are exemptions covering about 50 percent of the imports from covered countries, and additional exemptions for goods that implicate the trade agreements USMCA and CAFTA-DR.
Also, on July 20, President Trump unveiled three new tariffs for 554 Canadian-origin products, citing Section 338 of the Tariff Act of 1930 for the first time. They respectively cover (1) alcoholic beverages and related products, plus hockey equipment, (2) dairy and certain related confectionery goods, and (3) in response to alleged discriminatory treatment of US motor vehicles, other goods spanning wood, electronics, plastics, furniture, machinery, apparel, seeds, games, chemicals, and art. These tariffs take effect on August 19. TPC also modeled the effect of the new Section 301 tariff on Brazil. TPC's model release notes contain a comprehensive list of changes.
TPC tracks tariff developments and updates this page with details and estimates of how tariffs will affect federal revenues, households, and the economy.
Jump to:
1. US tariff policy snapshot
2. Household impact
3. Business impact
4. Tariff revenue
5. Explanation of tariff policies
6. Methodology
US Tariff Policy Snapshot
TPC estimates that the average tariff rate on all imports is 9.3 percent. Figure 1 shows average tariff rates on select items. The average tariff of a good changes as the administration announces new policies affecting that good. Country-specific tariffs can also shift a good’s average tariff rate if much of that good originates from the targeted country.
FIGURE 1
Figure 2 summarizes tariff rates by country. A country’s average tariff rate mostly reflects good-specific tariffs and the composition of its exports to the US. Some countries are subject to additional tariffs levied under Section 301 of the Trade Act of 1974. Tariffs announced but not yet in effect are not reflected in the figure.
FIGURE 2
Household Impact
TPC estimates that tariffs announced by the Trump administration will impose an average burden of about $920 per tax unit (or household) in calendar year 2026. Figure 3 shows that the average federal tax rate will rise by 0.8 percentage points for households in the bottom quintile—compared with a 0.6 percentage point increase for those in the top quintile.
FIGURE 3
Business Impact
Figure 4 traces how tariffs flow through various sectors of the economy. While tariffs are levied predominantly on tangible imports, their incidence can fall on other commodities. This is particularly true for goods such as aluminum that serve as inputs for domestic production.
Services as a group pick up about one-sixth of the total tariff burden, even though tariffs are not directly applied to services. This is because metals and minerals, chemical products, and computers and appliances are heavily used as inputs by health care, professional, and government services.
FIGURE 4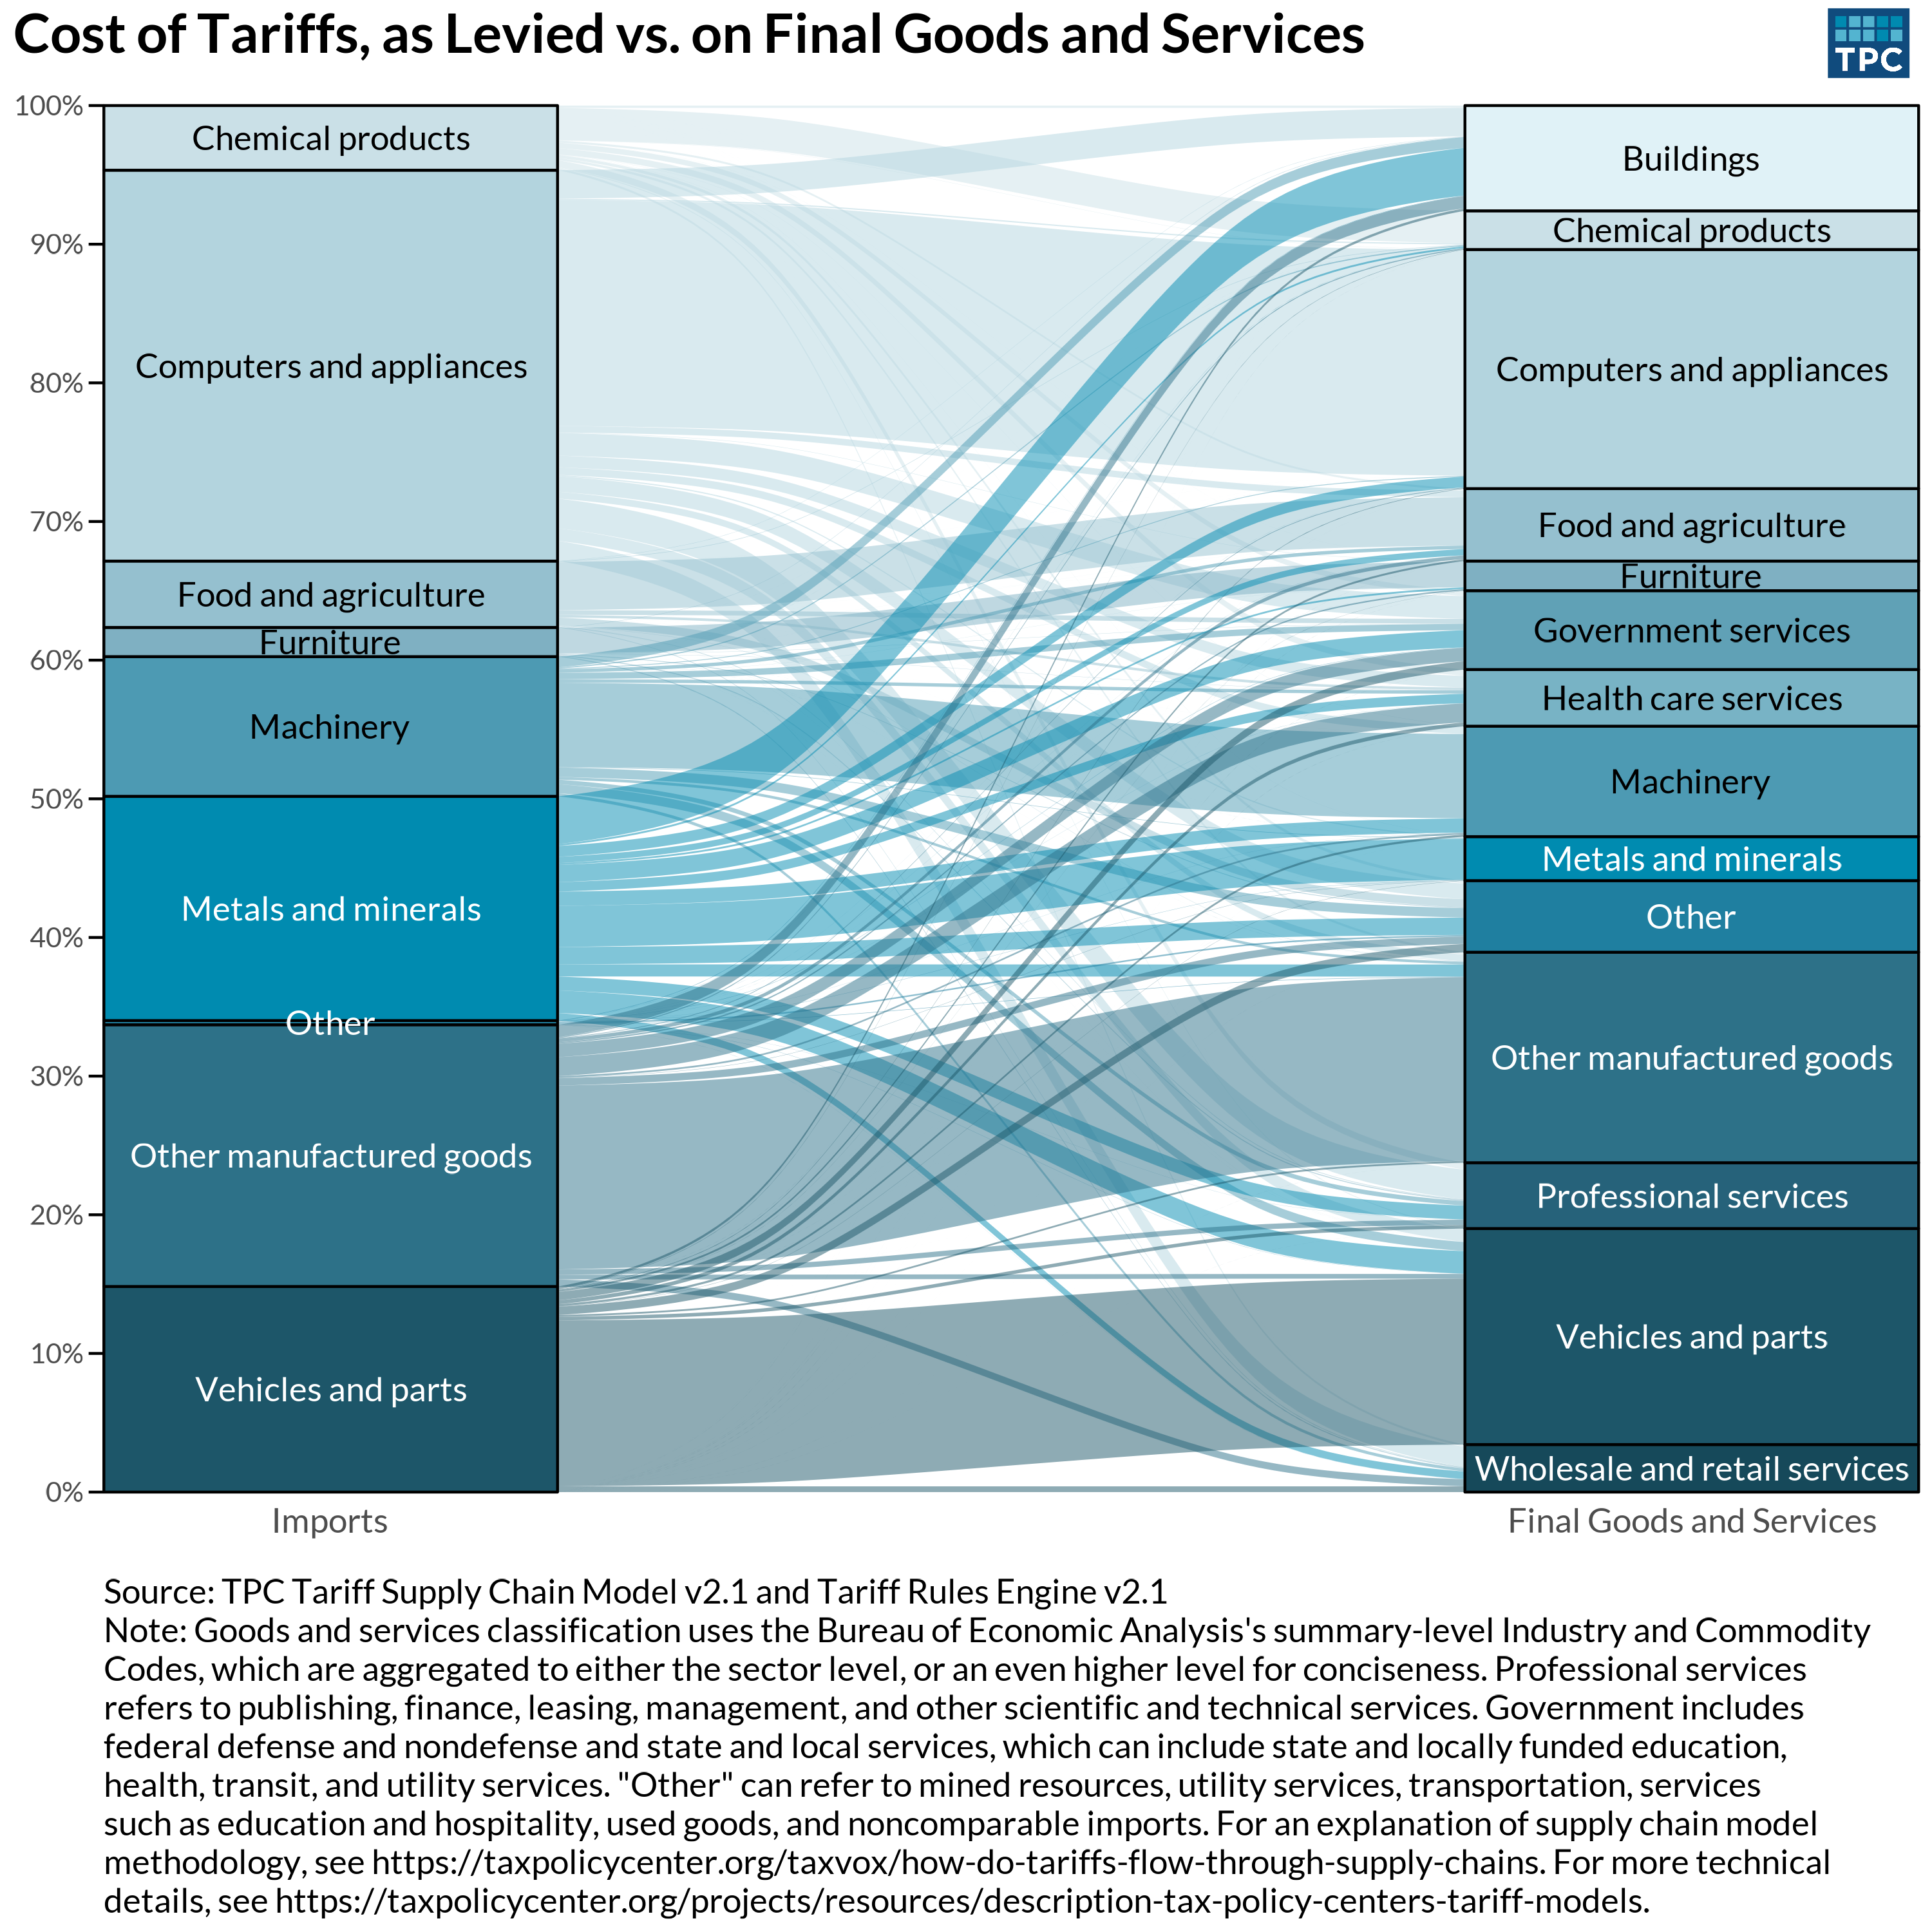
Tariff Revenue
TPC estimates that tariffs will raise about $1.7 trillion in fiscal years 2026 through 2036, with $179 billion raised in 2026. The decline in revenue over time reflects TPC’s assumption that US buyers will gradually shift away from imports with high duties.
FIGURE 5
Explanation of Tariff Policies
Figure 6 illustrates key categories of tariffs that significantly determine the taxation of imports. These categories often stack on top of each other, leading to total tariff rates that are higher than any single announcement suggests.
FIGURE 6
Table 1 provides more details on all the tariff types considered in TPC’s estimates.
Table 1
Methodology
To learn more about how TPC models the impact of tariffs, see a Description of TPC’s Tariff Models.
