What is the breakdown of revenues among federal, state, and local governments?
Federal, state, and local government receipts totaled $6.8 trillion in 2021. Federal receipts were 64 percent of the total, while state and local receipts (excluding intergovernmental transfers) were 21 percent and 15 percent, respectively.
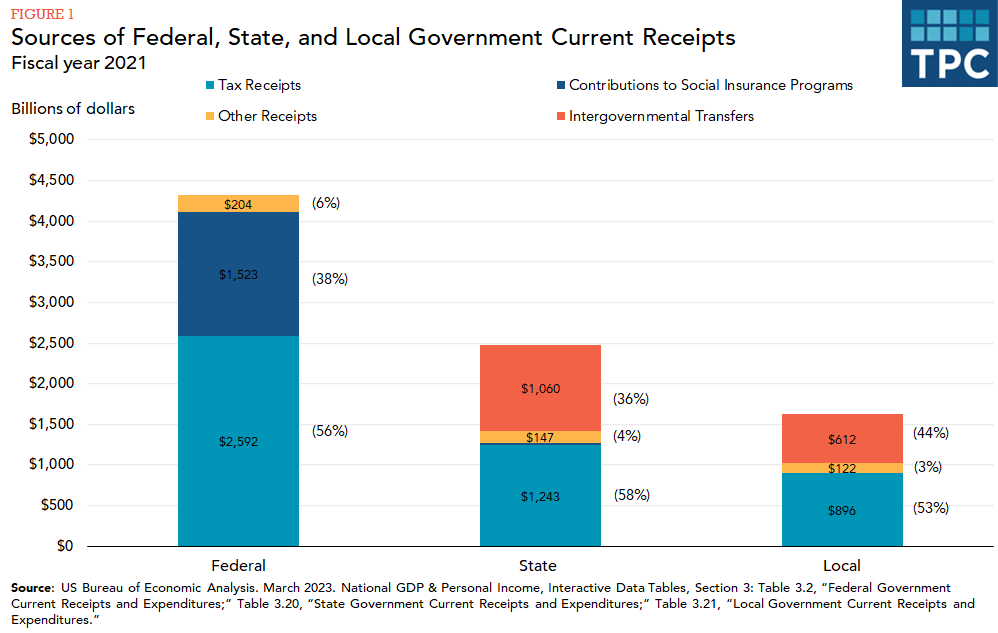
As shown in figure 1, federal government current receipts were just under $4.3 trillion in 2021. Tax receipts were 60 percent of this total, contributions to government social insurance programs were another 35 percent, and receipts from other sources accounted for the remainder.
State government current receipts were just under $2.5 trillion in 2021. Tax receipts (largely from income and sales taxes) were 50 percent of the total, contributions to social insurance programs were 1 percent, and other receipts were 6 percent. Forty-three percent of state government revenues ($1.1 billion) came from intergovernmental transfers, nearly all of which was from the federal government.
Local government current receipts were just over $1.6 trillion in 2021. Tax receipts (largely property taxes) were 55 percent of the total and other receipts were another 7 percent. Thirty-eight percent of local government revenues ($612 billion) came from intergovernmental transfers, most of which ($546 billion) were from state governments.
Federal aid to state and local governments in 2020 and 2021 was about twice as high compared with prior years due to various economic stimulus and relief programs to tackle the COVID-19 pandemic.
Updated January 2024
US Bureau of Economic Analysis. March 2023. National GDP & Personal Income, Interactive Data Tables, Section 3: Table 3.2, “Federal Government Current Receipts and Expenditures;” Table 3.20, “State Government Current Receipts and Expenditures;” Table 3.21, “Local Government Current Receipts and Expenditures.”